
Page 54 - Beaumont Basin Watermaster
P. 54
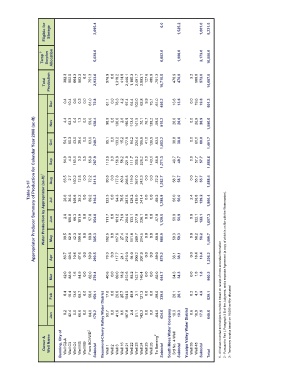
Eligible for   Storage  2,095.4                  0.0    1,525.2   1,601.0  5,221.5


                   Temp  3  Surplus  Allocation  5,029.0             6,802.0  1,996.0  2,173.0  16,000.0


                    Total   Production  382.3  552.5  664.3  583.3  0.0  751.3  2,933.6  976.9  0.0  1,310.2  414.9  2,446.1  1,105.3  2,491.7  2,093.1  127.6  495.9  -751.3  10,710.5  470.9  470.9  3.2  568.8  572.0  14,687.0


                       Dec   0.4  10.4  0.6  0.3  0.0  61.0  72.8  61.1  0.0  78.3  4.2  97.4  64.4  103.0  62.8  9.9  75.1  -61.0  495.2  13.6  13.6  0.0  19.6  19.6  601.3


                       Nov   4.4  63.3  0.4  1.3  0.0  59.0  128.4  98.9  0.0  136.0  2.6  196.9  113.4  141.5  70.1  76.7  138.2  -59.0  915.2  26.0  26.0  `  0.0  26.9  26.9  1,096.6


                       Oct   54.1  50.3  43.0  39.4  0.0  63.0  249.7  95.1  0.0  133.2  15.2  177.9  94.2  224.4  195.8  41.0  139.5  -63.0  1,053.2  38.8  38.8  0.0  60.0  60.0  1,401.7


                       Sep   64.9  4.0  150.1  3.0  0.0  65.9  287.9  113.9  0.0  156.9  58.2  221.9  111.7  305.2  226.2  0.0  143.1  -65.9  1,271.3  49.7  49.7  0.0  57.7  57.7  1,666.6


                    Water Production by Appropriator (ac-ft) 1  Jul  Jun  2.6  105.0  88.3  101.9  0.0  57.0  354.8  111.7  0.0  161.2  71.9  204.6  133.1  277.9  226.1  0.0  0.0  -57.0  1,298.9  1,129.5  50.9  50.9  0.0  122.1  122.1  1,800.4  1,657.3
             Table 3-1F  Appropriator Producer Summary of Production for Calendar Year 2008 (ac-ft)  Aug  63.5  26.6  2.7  36.6  160.2  148.6  12.8  35.2  0.0  0.0  72.2  69.2  311.3  316.2  80.8  123.3  0.0  0.0  177.8  94.3  80.4  78.5  266.5  287.5  119.0  128.2  367.0  415.0  243.3  241.4  0.0  0.0  0.0  0.0  -72.2  -69.2  1,262.7  58.7  56.0  58.7  56.0  0.0  2.4  55.7  126.8  55.7  129.2  1,688.4


                       Apr  May  39.5  83.7  62.9  69.6  42.3  10.6  100.6  67.6  0.0  0.0  60.0  59.0  305.3  290.5  102.5  78.3  0.0  0.0  117.6  117.7  27.4  24.1  212.4  216.0  111.8  94.0  260.7  200.2  214.5  207.9  0.0  0.0  0.0  0.0  -60.0  -59.0  986.9  879.2  59.3  38.1  59.3  38.1  0.0  0.0  58.2  18.4  58.2  18.4  1,409.7  1,226.2


                       Mar   42.0  88.9  1.6  84.9  0.0  62.0  279.4  40.6  0.0  69.0  18.2  212.6  83.2  142.7  140.4  0.0  0.0  -62.0  644.7  34.3  34.3  0.0  1.8  1.8  960.2 2 - Pursuant to Part I, Paragraph 3 B of the Judgment, and a separate Agreement (a copy of which is on file with the Watermaster).


                       Feb   0.4  16.4  13.6  69.7  0.0  59.0  159.1  17.0  0.0  26.6  25.7  154.5  49.8  3.1  121.3  0.0  0.0  -59.0  339.0  26.1  26.1  0.2  4.7  4.9  529.1 1 - All values rounded and subject to revision based on receipt of more accurate information


                       Jan   0.2  42.4  5.0  66.6  0.0  64.0  178.2 Beaumont-Cherry Valley Water District  53.7  0.0  41.6  8.6  197.9  2.4  51.1  143.3  0.0  0.0  -64.0  434.6  19.3  19.3  0.6  16.9  17.5  649.6  3.- Temporary surplus based on 16,000 ac-ft/yr allocated


                    Owner &  Well Name  Banning, City of  Well C2-A  Well C3  Well C4  Well M3  Well M9  From BCVWD 2  Subtotal  Well 1  Well 2  Well 3  Well 16  Well 21  Well 22  Well 23  Well 24  Well 25  Well 26  To Banning 2  Subtotal  South Mesa Water Company  3rd No. 4 Well  Subtotal  Yucaipa Valley Water District  Well 35  Well 48  Subtotal  Total