Page 83 - Beaumont Basin Watermaster
P. 83

2013 Reevaluation of the Beaumont
                                                                                             Basin Safe Yield
               Beaumont Basin Watermaster                                                              3-Apr-15


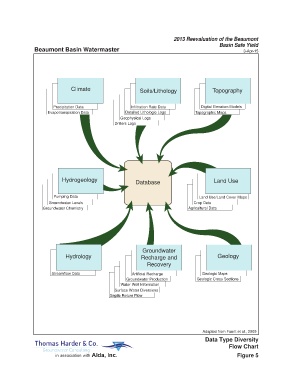
                               Climate                     Soils/Lithology                Topography


                       Precipitation Data               Infiltration Rate Data       Digital Elevation Models
                     Evapotranspiration Data         Detailed Lithologic Logs      Topographic Maps
                                                   Geophysical Logs
                                                 Drillers Logs


                           Hydrogeology                   Database                        Land Use


                       Pumping Data                                                 Land Use/Land Cover Maps
                     Groundwater Levels                                           Crop Data
                   Groundwater Chemistry                                        Agricultural Data


                                                             Groundwater
                            Hydrology                       Recharge and                    Geology
                                                              Recovery
                       Streamflow Data                  Artificial Recharge          Geologic Maps
                                                      Groundwater Production       Geologic Cross Sections
                                                   Water Well Information
                                                 Surface Water Diversions
                                               Septic Return Flow


                                                                                      Adapted from Faunt et al., 2009
                                                                                       Data Type Diversity
                                                                                                 Flow Chart
                                                                                                    Figure 5
   78   79   80   81   82   83   84   85   86   87   88