
Page 42 - Beaumont Basin Watermaster - 2015 Annual Report
P. 42
11,087
1,838
4,862
15,063
1,869
4,831
2,002
6,648
12,349
14,537
2,085
6,565
11,727
6,679
1,971
11,642
1,976
6,674
13,116
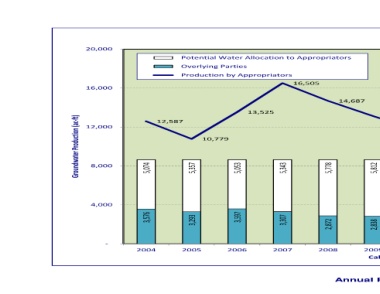
2009 2015 2014 2013 2012 2011 2010 Calendar Year Figure 3-4 Annual Production by Appropriators and Overalying Users (2004-15)
2,838
5,812
14,687
Potential Water Allocation to Appropriators
2008
5,778
2,872
16,505
2007
5,343
3,307
13,525 5,053 3,597 2006
Overlying Parties Production by Appropriators 10,779 5,357 3,293 2005
12,587
2004
5,074
3,576
20,000 16,000 12,000 8,000 Groundwater Production (ac‐ft) 4,000 ‐