
Page 31 - Beaumont Basin Watermaster - DRAFT 2016 Annual Report
P. 31
Section 3
Status of the Basin and Administration of the Judgment
3.5.1 Annual Storage Consolidation
Consistent with the new reporting format to document extractions, spreading and other
groundwater activities on a calendar year basis, Table 3-8 represents the consolidation of
each Appropriator’s storage account from CY 2003 through CY 2016. This table includes
annual production by Appropriator, their share of Temporary Surplus, supplemental water
recharge in its various forms, transfers between Appropriators, potable deliveries to parcels
previously owned by Overlying Users, and transfers of unused water from Overlying Users.
At the end of 2015, an overall total of 95,629.9 ac-ft of water were stored in the Basin for
future use; this total increased in CY 2016 by 5,795 ac-ft to a cumulative total of 101,425.0
ac-ft. Increased spreading of imported water by BCVWD and the City of Banning along with
low production totals by YVWD and SMWC were the primary reasons for the increase in
groundwater storage. Despite of the expiration of the Temporary Surplus allocation at the
end of CY 2013, the amount of water in storage at the end of CY 2016 was 612 ac-ft higher.
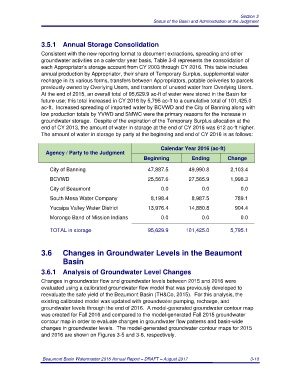
The amount of water in storage by party at the beginning and end of CY 2016 is as follows:
Calendar Year 2016 (ac-ft)
Agency / Party to the Judgment
Beginning Ending Change
City of Banning 47,887.5 49,990.8 2,103.4
BCVWD 25,567.6 27,565.9 1,998.3
City of Beaumont 0.0 0.0 0.0
South Mesa Water Company 8,198.4 8,987.5 789.1
Yucaipa Valley Water District 13,976.4 14,880.8 904.4
Morongo Band of Mission Indians 0.0 0.0 0.0
TOTAL in storage 95,629.9 101,425.0 5,795.1
3.6 Changes in Groundwater Levels in the Beaumont
Basin
3.6.1 Analysis of Groundwater Level Changes
Changes in groundwater flow and groundwater levels between 2015 and 2016 were
evaluated using a calibrated groundwater flow model that was previously developed to
reevaluate the safe yield of the Beaumont Basin (TH&Co, 2015). For this analysis, the
existing calibrated model was updated with groundwater pumping, recharge, and
groundwater levels through the end of 2016. A model-generated groundwater contour map
was created for Fall 2016 and compared to the model-generated Fall 2015 groundwater
contour map in order to evaluate changes in groundwater flow patterns and basin-wide
changes in groundwater levels. The model-generated groundwater contour maps for 2015
and 2016 are shown on Figures 3-5 and 3-6, respectively.
Beaumont Basin Watermaster 2016 Annual Report – DRAFT – August 2017 3-10