
Page 103 - Beaumont Basin Watermaster
P. 103
TDS concentrations are located in the South Beaumont Basin. Table 4-1 presents the
average and maximum TDS and Nitrate (as N) concentration for all the wells in the Beaumont
Basin and surrounding areas.
4.1.2 Nitrate-Nitrogen
Figure 4-3 shows the maximum Nitrate-N concentrations for 62 wells measured within and in
the vicinity of the Beaumont Basin wells during the 2013-2017 reporting period. A total of 35
wells are located inside the basin with the remaining 27 in the Singleton Basin / Edgar Canyon
and the South Beaumont Basin areas.
Nitrate-N concentration in drinking water wells from the CDPH database range from a low of
0.4 mg/l to a high of 7.78 mg/l and averaged 3.75 mg/L. The average of maximum
concentrations from individual wells was slightly higher at 3.8 mg/L.
Maximum Nitrate-N concentrations for domestic wells owned by Appropriators ranged from 0.4
to 7.8 mg/L and averaged 2.8 mg/L. Maximum concentrations for overlying wells was slightly
higher as it ranged from 1.2 to 7.8 mg/L and averaged 4.0 mg/L. The average concentration
for all potable wells was 2.6 mg/L.
In the Singleton Basin / Edgar Canyon area, the maximum Nitrate-N concentration ranged
from 0.7 to 19.0 mg/L and averaged 4.5 mg/L. The average concentration for all samples in
this area was 3.7 mg/L.
In the South Beaumont Basin, the maximum Nitrate-N concentration ranged from 4.0 to 22.0
mg/L and averaged 12.3 mg/L. The average concentration for all samples in this area was
10.7 mg/L.
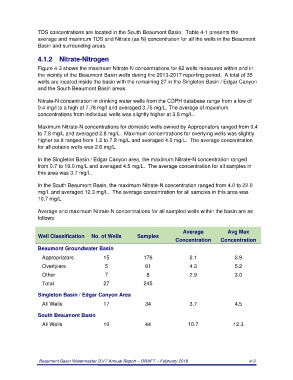
Average and maximum Nitrate-N concentrations for all sampled wells within the basin are as
follows:
Average Avg Max
Well Classification No. of Wells Samples
Concentration Concentration
Beaumont Groundwater Basin
Appropriators 15 176 2.1 2.9
Overlyiers 5 61 4.3 5.2
Other 7 8 2.9 3.0
Total 27 245
Singleton Basin / Edgar Canyon Area
All Wells 17 34 3.7 4.5
South Beaumont Basin
All Wells 10 44 10.7 12.3
Beaumont Basin Watermaster 2017 Annual Report – DRAFT – February 2018 4-3