
Page 34 - Beaumont Basin Watermaster
P. 34
Section 3
Status of the Basin and Administration of the Judgment
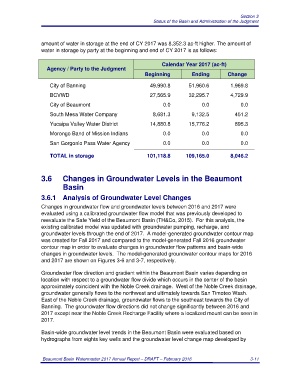
amount of water in storage at the end of CY 2017 was 8,352.3 ac-ft higher. The amount of
water in storage by party at the beginning and end of CY 2017 is as follows:
Calendar Year 2017 (ac-ft)
Agency / Party to the Judgment
Beginning Ending Change
City of Banning 49,990.8 51,960.6 1,969.8
BCVWD 27,565.9 32,295.7 4,729.9
City of Beaumont 0.0 0.0 0.0
South Mesa Water Company 8,681.3 9,132.5 451.2
Yucaipa Valley Water District 14,880.8 15,776.2 895.3
Morongo Band of Mission Indians 0.0 0.0 0.0
San Gorgonio Pass Water Agency 0.0 0.0 0.0
TOTAL in storage 101,118.8 109,165.0 8,046.2
3.6 Changes in Groundwater Levels in the Beaumont
Basin
3.6.1 Analysis of Groundwater Level Changes
Changes in groundwater flow and groundwater levels between 2016 and 2017 were
evaluated using a calibrated groundwater flow model that was previously developed to
reevaluate the Safe Yield of the Beaumont Basin (TH&Co, 2015). For this analysis, the
existing calibrated model was updated with groundwater pumping, recharge, and
groundwater levels through the end of 2017. A model-generated groundwater contour map
was created for Fall 2017 and compared to the model-generated Fall 2016 groundwater
contour map in order to evaluate changes in groundwater flow patterns and basin-wide
changes in groundwater levels. The model-generated groundwater contour maps for 2016
and 2017 are shown on Figures 3-6 and 3-7, respectively.
Groundwater flow direction and gradient within the Beaumont Basin varies depending on
location with respect to a groundwater flow divide which occurs in the center of the basin
approximately coincident with the Noble Creek drainage. West of the Noble Creek drainage,
groundwater generally flows to the northwest and ultimately towards San Timoteo Wash.
East of the Noble Creek drainage, groundwater flows to the southeast towards the City of
Banning. The groundwater flow directions did not change significantly between 2016 and
2017 except near the Noble Creek Recharge Facility where a localized mount can be seen in
2017.
Basin-wide groundwater level trends in the Beaumont Basin were evaluated based on
hydrographs from eights key wells and the groundwater level change map developed by
Beaumont Basin Watermaster 2017 Annual Report – DRAFT – February 2018 3-11