
Page 46 - Beaumont Basin Watermaster
P. 46
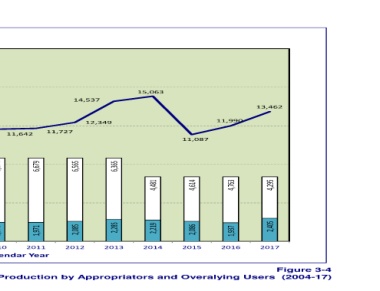
Figure 3-4


                                              13,462                            4,295            2,405   2017


                                                    11,990                      4,763              1,937   2016


                                                            11,087              4,614              2,086   2015


                                        15,063                                  4,481             2,219   2014       Annual Production by Appropriators and Overalying Users  (2004-17)


                                           14,537    12,349             6,365   6,565             2,285   2,085   2013 2012


                                                        11,727


                                                                                                         2011

                                                         11,642                                             Calendar Year
                                                                        6,679
                                                                                                   1,971


                                                 13,116                 6,674                      1,976   2010


                            Potential Water Allocation to Appropriators


                                           14,687                       5,812                   2,838    2009


                                Production by Overlying Parties
                                    16,505                              5,778                   2,872    2008
                                   Production by Appropriators


                                                13,525                  5,343                 3,307      2007


                                                           10,779       5,053                3,597       2006


                                                    12,587              5,357                 3,293      2005


                                                                                                         2004

                                                                                             3,576
                                                                        5,074


                       20,000          16,000          12,000          8,000  Groundwater Production (ac‐ft)   4,000   ‐