
Page 80 - Beaumont Basin Watermaster
P. 80
Unused Overlying Allocation in 2017 57.2 0.0 424.4 1,396.4 32.2 85.0 119.3 37.0 712.7 154.2 1,110.6 229.9 14.7 3.3 4.6 6.3 1.6 4,389.4
Overlying Water Right 58.1 735.8 426.0 1,398.9 450.0 116.2 119.3 154.9 1,704.0 154.9 1,115.0 232.4 15.5 3.9 5.4 7.7 1.9 6,700.0
Total 2 Production 0.9 168.1 661.9 830.0 1.6 0.00 2.50 0.00 2.5 417.8 26.9 4.2 31.2 0.0 74.7 43.2 117.9 66.3 0.0 925.1 991.4 0.7 4.3 2.4 0.8 0.6 0.9 1.4 0.4 2,404.7
Dec 0.0 0.0 60.1 60.1 47.1 1.1 0.9 2.0 5.4 4.4 9.8 0.5 0.0 67.1 67.6
Nov 0.0 0.0 80.1 80.1 61.1 2.7 0.4 3.1 6.0 5.1 11.2 0.7 0.0 58.4 59.1
Oct 0.0 0.0 10.1 10.1 55.7 2.8 0.0 2.8 8.7 4.3 13.0 12.4 0.0 101.8 114.1
1 0.0 40.8 52.7 93.5 73.4 3.7 0.0 3.7 9.1 3.9 13.0 2.9 0.0
Sep 112.1 115.0
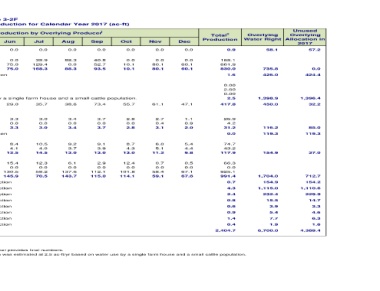
Monthly Water Production by Overlying Producer
Aug 0.0 88.3 0.0 88.3 38.6 3.4 0.0 3.4 9.2 3.7 13.0 6.1 0.0 137.6 143.7
Jul 0.0 38.9 129.4 168.3 35.7 3.0 0.0 3.0 10.5 4.0 14.5 12.3 0.0 58.2 70.5
Table 3-2F Overlying Producer - Summary of Production for Calendar Year 2017 (ac-ft) Jun 0.0 0.0 75.0 75.0 Annual consumption estimated based on water use by a single farm house and a small cattle population. 29.0 3.3 0.0 3.3 8.4 4.1 12.5 15.4 0.0 130.5 145.9
May 0.0 0.0 61.6 61.6 26.8 2.5 0.0 2.5 5.2 3.8 9.0 6.2 0.0 111.7 117.9
Apr 0.0 0.0 54.7 54.7 20.1 1.7 1.2 2.9 5.4 4.0 9.3 7.9 0.0 94.9 102.8 4.- Starting in 2008, the parcels owned by Oak Valley Partners were no longer used for agricultural purposes. Groundwater production was estimated at 2.5 ac-ft/yr based on water use by a single farm house and a small cattle population.
Mar 0.0 0.0 125.4 125.4 Water Duty Method Used to Estimate Annual Production 9.7 0.6 0.4 1.1 Water Duty Method Used to Estimate Annual Production 4.2 3.3 7.4 0.6 0.0 48.3 48.8 Water Duty Method Used to Estimate Annual Production Water Duty Method Used to Estimate Annual Production Water Duty Method Used to Estimate Annual Production Water Duty Method Used to Estimate Annual Production Water Duty Method Used to Estimate Annual Production Water Dut
Feb 0.9 0.0 6.5 6.5 9.0 1.0 0.6 1.6 1.3 1.2 2.5 0.8 0.0 4.7 5.5
Jan 0.0 0.0 6.3 6.3 11.6 1.0 0.7 1.7 1.4 1.4 2.7 0.4 0.0 0.0 0.4 3.- Monthly production provided by BCVWD - Feb 2015 - Production for Plantation by the Lake for 2015 was used for 2016 until producer provides final numbers.
Metered Yes Yes Yes No No No No Yes Yes No Yes Yes Yes Yes Yes No No No No No No No No 1.- All values rounded and subject to revision based on receipt of more accurate information in the future. 5.- Monthly production since 2011 provided by Clearwater Solutions, a company in charge of operating the water system. 6.- Actual monthly production provided by the Morongo Band of Mission Indians - May 2017.
Owner and Well Name Beckman, Walter M. (3) California Oak Valley Golf and Resort LLC (3) Oak Valley #1 Oak Valley #2 Subtotal Merlin Properties Oak Valley Partners, LP (4) Singleton Ranch #5 Singleton Ranch #7 Irrigation Stokes Subtotal Plantation on the Lake LLC (3) Rancho Calimesa Mobile Home Park (5) Well No.1 Well No.2 Subtotal Roman Catholic Bishop of San Bernardino Sharondale Mesa Owners Association (5) Well No.1