
Page 7 - Yucaipa Valley Water District
P. 7
Workshop Memorandum No. 17-009 Page 3 of 12
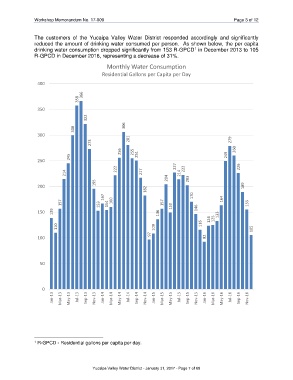
The customers of the Yucaipa Valley Water District responded accordingly and significantly
reduced the amount of drinking water consumed per person. As shown below, the per capita
drinking water consumption dropped significantly from 153 R-GPCD in December 2013 to 105
1
R-GPCD in December 2016, representing a decrease of 31%.
Monthly Water Consumption
Residential Gallons per Capita per Day
400
366
358
350
322
300 306
300
273 281 279
256 255 260
245 251 249
250
222 227 222 226
214 217 214
195 204 203
200 189
182
167 170 164
157 153 154 160 157 150 155
150 139 136 146 125 133
110 109 116 124 105
97
100 92
50
0
Jan-13 Mar-13 May-13 Jul-13 Sep-13 Nov-13 Jan-14 Mar-14 May-14 Jul-14 Sep-14 Nov-14 Jan-15 Mar-15 May-15 Jul-15 Sep-15 Nov-15 Jan-16 Mar-16 May-16 Jul-16 Sep-16 Nov-16
1 R-GPCD - Residential gallons per capita per day.
Yucaipa Valley Water District - January 31, 2017 - Page 7 of 68