
Page 73 - Beaumont Basin Watermaster
P. 73
Beaumont Basin Watermaster
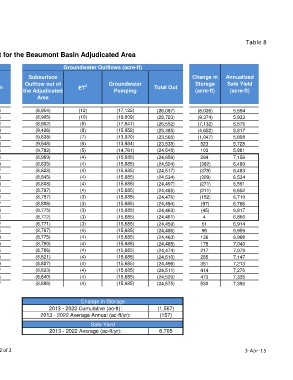
Table 8
2013 - 2032 Projected Groundwater Budget for the Beaumont Basin Adjudicated Area
Groundwater Inflows (acre-ft) Groundwater Outflows (acre-ft)
Subsurface Deep Infiltration of Subsurface Change in Annualized
Subsurface
Inflow into the Imported Precipitation and Return Flow Inflow from the Total In Outflow out of 2 Groundwater Total Out Storage Safe Yield
Water
Adjudicated Recharge Runoff in Stream Mountain Block the Adjudicated ET Pumping (acre-ft) (acre-ft)
Area Channels 1 Area
2006 6,921 3,501 3,668 1,075 2,891 18,056 (8,954) (12) (17,122) (26,087) (8,026) 5,594
2007 7,161 4,501 3,672 1,098 2,913 19,345 (8,905) (10) (19,809) (28,723) (9,374) 5,933
2008 7,754 3,933 3,683 1,110 2,932 19,412 (8,902) (8) (17,641) (26,552) (7,132) 6,576
2009 7,493 5,482 3,687 1,133 2,934 20,729 (9,426) (8) (15,952) (25,385) (4,652) 5,817
2010 7,654 7,065 3,690 1,156 2,949 22,514 (9,638) (7) (13,920) (23,565) (1,047) 5,808
2011 7,442 8,779 3,695 1,178 2,964 24,058 (9,548) (6) (13,984) (23,538) 523 5,728
2012 7,788 8,983 3,698 1,201 2,984 24,655 (9,782) (5) (14,761) (24,548) 103 5,881
2013 8,219 8,823 3,700 1,224 2,988 24,954 (8,969) (4) (15,685) (24,659) 294 7,156
2014 7,379 8,823 3,701 1,246 2,990 24,140 (8,835) (4) (15,685) (24,524) (382) 6,480
2015 7,326 8,823 3,696 1,300 2,992 24,137 (8,828) (4) (15,685) (24,517) (379) 6,483
2016 7,332 8,823 3,693 1,353 3,002 24,203 (8,845) (4) (15,685) (24,534) (329) 6,534
2017 7,310 8,823 3,689 1,406 2,995 24,223 (8,808) (4) (15,685) (24,497) (271) 6,591
2018 7,310 8,823 3,685 1,459 2,996 24,274 (8,797) (4) (15,685) (24,485) (211) 6,652
2019 7,309 8,823 3,681 1,512 2,997 24,322 (8,787) (3) (15,685) (24,476) (152) 6,710
2020 7,326 8,823 3,677 1,565 3,006 24,397 (8,806) (3) (15,685) (24,494) (97) 6,766
2021 7,305 8,823 3,673 1,619 2,998 24,418 (8,775) (3) (15,685) (24,463) (45) 6,817
2022 7,303 8,823 3,669 1,672 2,998 24,465 (8,772) (3) (15,685) (24,461) 4 6,866
2023 7,301 8,823 3,665 1,725 2,998 24,512 (8,771) (3) (15,685) (24,459) 51 6,914
2024 7,316 8,823 3,661 1,778 3,006 24,585 (8,797) (4) (15,685) (24,486) 96 6,959
2025 7,294 8,823 3,657 1,831 2,998 24,603 (8,775) (4) (15,685) (24,463) 136 6,998
2026 7,291 8,823 3,653 1,884 2,997 24,649 (8,780) (4) (15,685) (24,468) 178 7,040
2027 7,289 8,823 3,649 1,937 2,997 24,695 (8,786) (4) (15,685) (24,474) 217 7,079
2028 7,304 8,823 3,650 2,017 3,004 24,798 (8,821) (4) (15,685) (24,510) 285 7,147
2029 7,282 8,823 3,653 2,097 2,995 24,849 (8,807) (4) (15,685) (24,496) 351 7,213
2030 7,279 8,823 3,654 2,176 2,994 24,927 (8,823) (4) (15,685) (24,511) 414 7,276
2031 7,276 8,823 3,657 2,256 2,993 25,005 (8,840) (4) (15,685) (24,529) 473 7,335
2032 7,291 8,823 3,658 2,335 3,000 25,107 (8,886) (4) (15,685) (24,575) 530 7,392
Notes:
1 Stream channels include Noble Creek and Marshall Creek. Change in Storage
2 ET = Evapotranspiration. 2013 - 2022 Cumulative (ac-ft): (1,567)
2013 - 2022 Average Annual (ac-ft/yr): (157)
Safe Yield
2013 - 2022 Average (ac-ft/yr): 6,705
Page 2 of 2 3-Apr-15