
Page 69 - Beaumont Basin Watermaster
P. 69
Beaumont Basin Watermaster
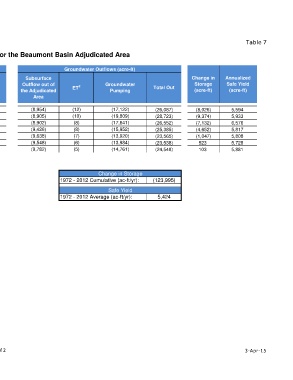
Table 7
40-Year Historical Groundwater Budget for the Beaumont Basin Adjudicated Area
Groundwater Inflows (acre-ft) Groundwater Outflows (acre-ft)
Subsurface Deep Infiltration of Subsurface Change in Annualized
Inflow into the Imported Water Precipitation and Subsurface Inflow Outflow out of Groundwater Storage Safe Yield
Year Return Flow from the Mountain Total In ET 2 Total Out
Adjudicated Recharge Runoff in Stream Block the Adjudicated Pumping (acre-ft) (acre-ft)
Area Channels 1 Area
2006 6,921 3,501 3,668 1,075 2,891 18,056 (8,954) (12) (17,122) (26,087) (8,026) 5,594
2007 7,161 4,501 3,672 1,098 2,913 19,345 (8,905) (10) (19,809) (28,723) (9,374) 5,933
2008 7,754 3,933 3,683 1,110 2,932 19,412 (8,902) (8) (17,641) (26,552) (7,132) 6,576
2009 7,493 5,482 3,687 1,133 2,934 20,729 (9,426) (8) (15,952) (25,385) (4,652) 5,817
2010 7,654 7,065 3,690 1,156 2,949 22,514 (9,638) (7) (13,920) (23,565) (1,047) 5,808
2011 7,442 8,779 3,695 1,178 2,964 24,058 (9,548) (6) (13,984) (23,538) 523 5,728
2012 7,788 8,983 3,698 1,201 2,984 24,655 (9,782) (5) (14,761) (24,548) 103 5,881
Notes:
1 Stream channels include Noble Creek and Marshall Creek.
2 ET = Evapotranspiration. Change in Storage
1972 - 2012 Cumulative (ac-ft/yr): (123,995)
Safe Yield
1972 - 2012 Average (ac-ft/yr): 5,424
2 of 2 3-Apr-15