
Page 64 - Beaumont Basin Watermaster
P. 64
Beaumont Basin Watermaster
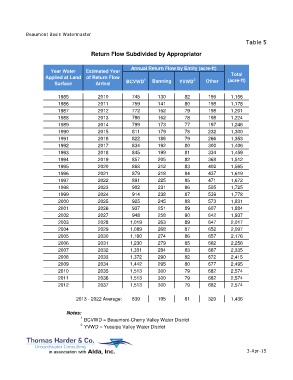
Table 5
Return Flow Subdivided by Appropriator
Annual Return Flow by Entity (acre-ft)
Year Water Estimated Year
Applied at Land of Return Flow 1 2 Total
Surface Arrival BCVWD Banning YVWD Other (acre-ft)
1985 2010 745 130 82 199 1,156
1986 2011 759 141 80 198 1,178
1987 2012 772 152 79 198 1,201
1988 2013 786 162 78 198 1,224
1989 2014 799 173 77 197 1,246
1990 2015 811 179 78 232 1,300
1991 2016 822 186 79 266 1,353
1992 2017 834 192 80 300 1,406
1993 2018 845 199 81 334 1,459
1994 2019 857 205 82 368 1,512
1995 2020 868 212 83 402 1,565
1996 2021 879 218 84 437 1,619
1997 2022 891 225 85 471 1,672
1998 2023 902 231 86 505 1,725
1999 2024 914 238 87 539 1,778
2000 2025 925 245 88 573 1,831
2001 2026 937 251 89 607 1,884
2002 2027 948 258 90 642 1,937
2003 2028 1,019 263 89 647 2,017
2004 2029 1,089 268 87 652 2,097
2005 2030 1,160 274 86 657 2,176
2006 2031 1,230 279 85 662 2,256
2007 2032 1,301 284 83 667 2,335
2008 2033 1,372 290 82 672 2,415
2009 2034 1,442 295 80 677 2,495
2010 2035 1,513 300 79 682 2,574
2011 2036 1,513 300 79 682 2,574
2012 2037 1,513 300 79 682 2,574
2013 - 2022 Average: 839 195 81 320 1,436
Notes:
1 BCVWD = Beaumont-Cherry Valley Water District
2 YVWD = Yucaipa Valley Water District
3-Apr-15