
Page 66 - Beaumont Basin Watermaster
P. 66
Beaumont Basin Watermaster
Table 7
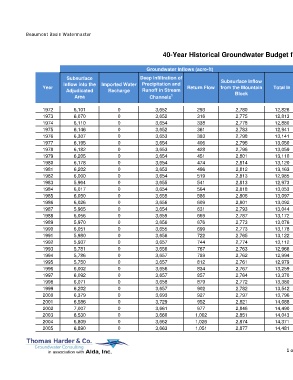
40-Year Historical Groundwater Budget for the Beaumont Basin Adjudicated Area
Groundwater Inflows (acre-ft) Groundwater Outflows (acre-ft)
Subsurface Deep Infiltration of Subsurface Change in Annualized
Inflow into the Imported Water Precipitation and Subsurface Inflow Outflow out of Groundwater Storage Safe Yield
Year Return Flow from the Mountain Total In ET 2 Total Out
Adjudicated Recharge Runoff in Stream Block the Adjudicated Pumping (acre-ft) (acre-ft)
Area Channels 1 Area
1972 6,101 0 3,652 293 2,780 12,826 (8,091) (25) (9,033) (17,149) (4,321) 4,712
1973 6,070 0 3,652 316 2,775 12,813 (9,223) (24) (6,020) (15,267) (2,451) 3,569
1974 6,110 0 3,654 338 2,778 12,880 (9,344) (23) (5,879) (15,246) (2,359) 3,520
1975 6,146 0 3,652 361 2,783 12,941 (9,132) (23) (6,286) (15,441) (2,495) 3,791
1976 6,307 0 3,653 383 2,798 13,141 (9,028) (22) (7,296) (16,346) (3,201) 4,095
1977 6,195 0 3,654 406 2,795 13,050 (9,068) (21) (5,783) (14,871) (1,815) 3,968
1978 6,182 0 3,653 428 2,796 13,059 (9,197) (21) (5,589) (14,807) (1,741) 3,848
1979 6,205 0 3,654 451 2,801 13,110 (9,033) (21) (6,071) (15,125) (2,011) 4,060
1980 6,178 0 3,654 474 2,814 13,120 (8,632) (20) (5,004) (13,655) (534) 4,470
1981 6,202 0 3,653 496 2,812 13,163 (8,437) (19) (5,625) (14,080) (914) 4,711
1982 6,000 0 3,654 519 2,813 12,985 (7,650) (18) (4,669) (12,337) 649 5,318
1983 5,964 0 3,655 541 2,813 12,973 (7,156) (19) (3,716) (10,891) 2,078 5,793
1984 6,017 0 3,654 564 2,818 13,053 (7,333) (20) (4,493) (11,847) 1,201 5,695
1985 6,050 0 3,655 586 2,806 13,097 (7,055) (21) (5,834) (12,909) 188 6,022
1986 6,026 0 3,656 609 2,801 13,092 (6,707) (22) (5,875) (12,604) 488 6,363
1987 5,965 0 3,654 631 2,793 13,044 (6,421) (23) (6,638) (13,082) (37) 6,602
1988 6,056 0 3,659 669 2,787 13,172 (6,313) (25) (7,253) (13,592) (418) 6,836
1989 5,970 0 3,656 676 2,773 13,076 (5,160) (27) (10,199) (15,385) (2,306) 7,893
1990 6,051 0 3,655 699 2,773 13,178 (5,073) (26) (11,599) (16,698) (3,513) 8,087
1991 5,980 0 3,656 722 2,765 13,122 (5,332) (27) (9,765) (15,124) (1,989) 7,776
1992 5,937 0 3,657 744 2,774 13,112 (5,915) (27) (8,784) (14,726) (1,612) 7,172
1993 5,781 0 3,656 767 2,763 12,966 (6,750) (28) (6,537) (13,315) (348) 6,189
1994 5,786 0 3,657 789 2,762 12,994 (7,807) (28) (7,294) (15,129) (2,130) 5,165
1995 5,750 0 3,657 812 2,761 12,979 (8,146) (28) (5,140) (13,314) (334) 4,806
1996 6,002 0 3,656 834 2,767 13,259 (9,177) (29) (5,890) (15,096) (1,834) 4,056
1997 6,092 0 3,657 857 2,764 13,370 (8,954) (29) (7,158) (16,140) (2,763) 4,395
1998 6,071 0 3,658 879 2,772 13,380 (8,786) (28) (6,700) (15,514) (2,129) 4,571
1999 6,202 0 3,657 902 2,782 13,542 (8,537) (27) (9,010) (17,575) (4,027) 4,983
2000 6,379 0 3,693 927 2,797 13,796 (8,648) (26) (13,237) (21,911) (8,114) 5,123
2001 6,586 0 3,729 952 2,821 14,088 (8,607) (23) (13,722) (22,352) (8,256) 5,466
2002 7,007 0 3,661 977 2,846 14,490 (8,677) (20) (17,631) (26,327) (11,831) 5,800
2003 6,530 0 3,660 1,002 2,851 14,043 (8,995) (18) (11,424) (20,436) (6,393) 5,031
2004 6,809 0 3,662 1,026 2,874 14,371 (8,849) (15) (16,197) (25,061) (10,683) 5,514
2005 6,890 0 3,663 1,051 2,877 14,481 (8,849) (13) (14,064) (22,926) (8,436) 5,628
1 of 2 3-Apr-15