
Page 62 - Beaumont Basin Watermaster
P. 62
Beaumont Basin Water Master
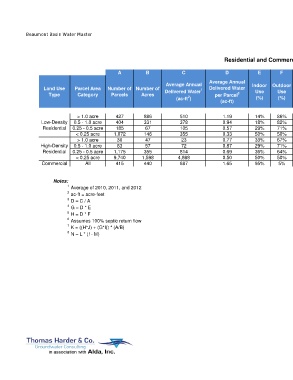
Table 4
Residential and Commercial Return Flow Analysis
A B C D E F G H I J K L M N
Average Weighted
Average Annual Total Annual
Average Annual Indoor Outdoor Indoor Use Outdoor Use Annual Total Average Annual
Land Use Parcel Area Number of Number of Delivered Water 1 Delivered Water Use Use Indoor Use 4 Outdoor Use 5 6 Infiltration Return Flow Return Flow Road Return Flow
Type Category Parcels Acres per Parcel 3 (ac-ft/parcel) (ac-ft/parcel) Infiltration 7 Factor Rate 8
2
(ac-ft ) (ac-ft) (%) (%) (%) (%) Rate Rate (ac-ft/ac)
(ac-ft/ac) (ac-ft/ac)
> 1.0 acre 427 886 510 1.19 14% 86% 0.17 1.03 100% 25% 0.20
Low-Density 0.5 - 1.0 acre 404 331 378 0.94 18% 82% 0.17 0.77 100% 25% 0.44 0.66 0.12 0.58
Residential 0.25 - 0.5 acre 185 67 105 0.57 29% 71% 0.17 0.40 100% 25% 0.73
< 0.25 acre 1,072 146 355 0.33 50% 50% 0.17 0.17 100% 25% 1.51
> 1.0 acre 30 47 23 0.77 33% 67% 0.25 0.52 0% 25% 0.08
High-Density 0.5 - 1.0 acre 83 57 72 0.87 29% 71% 0.25 0.62 0% 25% 0.23 0.38 0.24 0.29
Residential 0.25 - 0.5 acre 1,175 355 814 0.69 36% 64% 0.25 0.44 0% 25% 0.37
< 0.25 acre 9,740 1,598 4,868 0.50 50% 50% 0.25 0.25 0% 25% 0.38
Commercial All 415 440 687 1.65 95% 5% 1.57 0.08 0% 25% 0.02 0.02 0.24 0.02
Notes:
1 Average of 2010, 2011, and 2012
2 ac-ft = acre-feet
3 D = C / A
4 G = D * E
5 H = D * F
6 Assumes 100% septic return flow
7 K = ((H*J) + (G*I)) * (A/B)
8 N = L * (1- M)
3-Apr-15