
Page 53 - Beaumont Basin Watermaster - 2015 Annual Report
P. 53
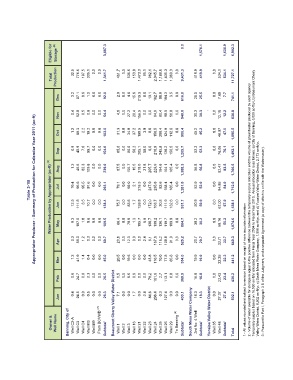
Eligible for   Storage  (2)  3,687.3                   0.0    1,576.1   1,638.9  6,902.3


                       Total   Production  32.5  776.6  197.5  335.1  0.0  0.0  1,341.7  461.7  0.0  535.6  153.8  1,473.3  95.1  982.1  2,045.7  1,188.6  1,435.3  1,060.3  0.0  9,431.3  419.9  419.9  0.0  534.1  534.1  11,727.1


                          Dec   3.2  87.1  0.6  1.2  0.0  0.0  92.0  2.9  0.0  4.0  15.6  219.3  0.0  13.1  162.7  90.8  104.3  3.5  0.0  616.0  25.5  25.5  0.0  7.69  7.7  741.1


                          Nov   0.4  52.8  0.5  0.8  0.0  0.0  54.4  4.8  0.0  27.2  20.4  156.5  0.0  0.0  94.9  80.4  98.9  56.8  0.0  540.0  30.3  30.3  `  0.0  12.18  12.2  636.8


                          Oct   1.2  80.3  2.2  19.2  0.0  0.0  103.0  31.3  0.0  34.9  37.2  190.5  3.9  0.0  156.5  208.4  124.9  112.8  0.0  900.4  45.2  45.2  0.0  46.97  47.0  1,095.5


                          Sep  Aug  0.9  1.3  45.9  45.5  7.6  82.3  99.7  109.8  0.0  0.0  0.0  0.0  154.0  239.0  65.0  87.5  0.0  0.0  80.0  105.7  58.2  15.5  205.1  218.0  58.0  21.8  0.0  205.7  210.9  229.9  245.8  184.6  136.2  154.1  150.5  165.4  0.0  0.0  1,209.7  1,388.3  52.3  56.8  52.3  56.8  0.0  0.0  76.06  82.47  76.1  82.5  1,492.1  1,766.5


                      Water Production by Appropriator (ac-ft)  (1)  Jun  12.5  111.8  3.5  10.7  0.0  0.0  138.4  75.7  0.0  83.6  1.7  159.8  0.0  172.0  163.7  30.8  111.9  132.6  0.0  931.7  50.9  50.9  0.0  67.00  67.0  1,188.1 2.- Volume of water available for storage is equal to the positive difference between the temporary surplus allocation and the volume of groundwater produced by each agency.  Temporary surplus based on 16,000 ac-ft/yr allocated from Fiscal Year 2004 to Fi


              Table 3-1B  Appropriator Producer - Summary of Production for Calendar Year 2011 (ac-ft)  Jul  10.4  95.6  95.5  91.6  0.0  0.0  293.1  79.1  0.0  92.0  2.1  218.3  0.0  247.9  235.8  82.6  158.4  165.4  0.0  1,281.8  52.9  52.9  0.0  84.85  84.9  1,712.6


                          Apr  May  0.3  0.3  107.5  59.0  1.0  1.2  0.6  0.3  0.0  0.0  0.0  0.0  109.5  60.7  66.4  20.8  0.0  0.0  70.0  12.0  1.3  0.0  105.7  0.0  5.8  2.8  130.7  6.1  139.2  167.6  136.1  116.2  119.7  108.8  109.9  91.0  0.0  0.0  884.7  525.2  30.2  20.7  30.2  20.7  0.0  0.0  50.16  33.71  50.2  33.7  1,074.6  640.3 Valley Water District, 6,802 ac-ft/yr, c) South Mesa Water Company, 1,996 ac-ft/yr, and d) Yucaipa Valley Water District, 2,173 ac-ft/yr. 3.- Pu


                          Mar   1.2  41.9  1.4  0.4  0.0  0.0  45.0  20.5  0.0  19.6  0.0  0.0  0.0  43.8  116.5  10.0  77.8  65.8  0.0  354.0  19.9  19.9  0.0  22.25  22.3  441.2


                          Feb   0.6  24.7  0.9  0.3  0.0  0.0  26.5  0.5  0.0  6.6  0.0  0.0  0.0  78.2  161.6  2.7  113.1  6.8  0.0  369.5  16.8  16.8  0.0  23.43  23.4  436.2 1.- All values rounded and subject to revision based on receipt of more accurate information


                          Jan   0.4  24.5  0.9  0.5  0.0  0.0  26.3 Beaumont Cherry Valley Water District  7.1  0.0  0.0  1.7  0.0  2.8  84.6  206.4  0.3  127.4  0.0  0.0  430.1  18.3  18.3  0.0  27.37  27.4  502.1


                       Owner &  Well Name  Banning, City of  Well C2-A  Well C3  Well C4  Well M3  Well M9  From BCVWD  (3)  Subtotal  Well 1  Well 2  Well 3  Well 16  Well 21  Well 22  Well 23  Well 24  Well 25  Well 26  Well 29  To Banning  (3)  Subtotal  South Mesa Water Company  3rd No. 4 Well  Subtotal  Yucaipa Valley Water District  Well 35  Well 48  Subtotal  Total