
Page 58 - Beaumont Basin Watermaster - 2015 Annual Report
P. 58
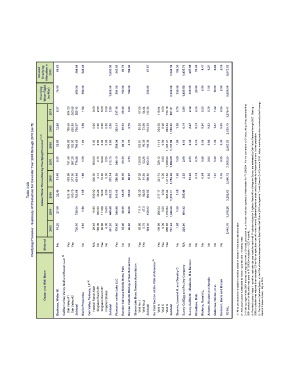
Unused   Overlying   Allocation in   2010  68.63  384.88  548.46  1,803.50  243.82  80.70  154.00  67.67  1,348.19  199.30  1,435.70  297.88  19.30  4.47  6.21  8.68  2.15  6,673.53


                   Overlying   Water Right   (ac-ft/yr)  75.00  950.00  550.00  1,806.00  581.00  150.00  154.00  200.00  2,200.00  200.00  1,439.50  300.00  20.00  5.00  7.00  10.00  2.50  8,650.00


                       2010  6.37  304.23  260.89  565.12  1.54  0.00  2.50  0.00  0.00  2.50  337.19  69.30  0.00  67.69  64.64  132.33  118.64  0.00  733.16  851.81  0.70  3.80  2.12  0.70  0.53  0.79  1.32  0.35  1,976.47


                       2009  2008  12.88  12.69  135.69  596.93  630.98  183.50  766.67  780.43  1.58  1.60  0.00  0.00  2.50  2.50  0.00  0.00  0.00  0.00  2.50  2.50  352.31  354.04  69.30  69.30  0.70  0.70  80.30  102.91  73.98  90.39  154.28  193.30  204.36  11.18  0.00  0.00  954.24  1,126.41  1,158.60  1,137.59  1.05  1.05  4.19  4.19  2.27  2.34  0.73  0.75  0.54  0.55  0.83  0.85  1.37  1.40  0.35  0.35  2,530.15  2,563.63
                   Annual Water Production by Overlying Producer  (1) (2)  2007  2006  8.31  11.49  181.68  453.58  597.30  377.90  778.98  831.48  1.59  1.58  300.00  300.00  2.10  2.14  10.00  10.00  0.00  0.00  312.10  312.14  344.19  350.09  69.30  68.25  0.70  58.97  130.06  97.02  52.28  91.60  182.34  188.62  329.12  341.74  0.00  0.00  1,269.93  1,411.64  1,599.05  1,753.38  1.05  1.05  2.68  2.63  2.33  13.22  0.75  0.74  0.55  0.54  0.84  0.83  1.39  1.37  0.35  0.35  3,306


             Table 3-2A Overlying Producer - Summary of Production for Calendar Year 2003 through 2010 (ac-ft)  2005  22.40  523.18  180.70  703.88  1.55  300.00  40.22  10.00  0.00  350.22  310.19  68.25  55.60  98.39  82.56  180.95  217.17  0.00  995.94  1,213.11  1.05  385.44  3,292.63


                       2004  27.00  728.64  1.58  19.60  300.00  111.08  10.00  440.68  340.88  68.25  59.06  111.0  47.0  158.02  268.04  0.00  1,078.64  1,346.68  1.05  404.42  3,576.26 3.- Metering began in late 2004 and was not reported monthly. One total production value for each well was reported to Watermaster for FY 2003/04 . For the conversion to CY accounting, it was assumed that  4.- Provided copies of state filing with annual calendar year totals for each well. Production


                       2003  16.20  736.20  3.60  29.40  180.00  85.80  6.00  301.20  178.60  35.40  46.80  98.60  5.70  104.30  130.80  0.00  660.63  791.43  1.05  226.00  2,440.78 2008, production was reduced to an estimated 2.5 ac-ft/yr as agricultural use of the land ended. Estimate based on water use by a single farm house and a small bovine population.

                    Metered  No  Yes  Yes  No  N/A  No  Yes  No  Yes  No  No  Yes  Yes  Yes  Yes  Yes  No  N/A  No  No  No  No  No  No


                    Owner and Well Name  California Oak Valley Golf and Resort LLC  (3)  Rancho Calimesa Mobile Home Park Roman Catholic Bishop of San Bernardino Sharondale Mesa Owners Association  So Calif Section of the PGA of America  (5)  Stearns, Leonard M. and Dorothy D. Sunny-Cal Egg and Poultry Company Sunny-Cal North - Manheim, M & Berman  1.- All values rounded and subject to revision based on receipt of more accurate information. 2.- Annual production is estimated for Over


                         Beckman, Walter M.     Oak Valley #1     Oak Valley #2  Subtotal  Merlin Properties  Oak Valley Partners, LP  (4)  Haskell Ranch-Main  Singleton Ranch #5  Singleton Ranch #7  Irrigation Stokes  Subtotal  Plantation on the Lake LLC      Well No.1      Well No.2  Subtotal      Well A      Well C      Well D  Subtotal  Nikodinov, Nick  McAmis, Ronald L.  Aldama, Nicolas and Amalia  Gutierrez, Hector, et al.  Darmont, Boris and Miriam  TOTAL  Band of Mission Indi