
Page 62 - Beaumont Basin Watermaster - 2015 Annual Report
P. 62
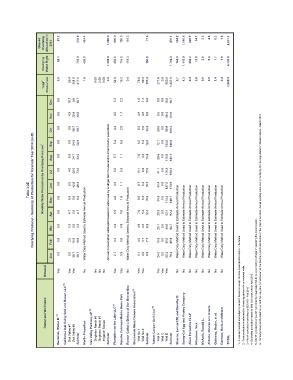
Unused   Overlying   Allocation in   2014  57.2  318.8  424.4  1,396.4  396.0  100.0  119.3  17.6  476.1  154.2  1,110.6  229.9  14.7  3.3  4.6  6.3  1.6  4,831.1


                   Overlying   Water Right  58.1  735.8  426.0  1,398.9  450.0  116.2  119.3  154.9  1,704.0  154.9  1,115.0  232.4  15.5  3.9  5.4  7.7  1.9  6,700.0


                    Total 2  Production  0.9  55.4  361.6  417.0  1.6  0.00  2.50  0.00  2.5  54.0  16.2  0.0  78.0  59.3  137.3  277.6  0.0  950.3  1,227.9  0.7  4.3  2.4  0.8  0.6  0.9  1.4  0.4  1,868.9


                       Dec  0.0  18.7  0.0  18.7  5.3  2.3  1.8  1.7  3.5  0.8  0.0  16.0  16.7


                       Nov  0.0  4.9  25.9  30.8  4.5  1.7  4.9  4.6  9.5  3.5  0.0  58.4  61.9

                       Oct  0.0  0.0  98.7  98.7  4.4  2.0  8.8  5.5  14.3  23.5  0.0  85.8  109.3


                       Sep  Aug  0.0  0.0  0.0  5.9  54.9  24.7  54.9  30.5  5.2  5.7  0.6  1.1  6.5  7.0  5.4  4.4  12.0  11.4  12.1  29.6  0.0  0.0  134.5  111.5  146.6  141.1
                   Monthly Water Production by Overlying Producer 1  Jul  0.0  0.0  4.0  5.5  69.0  73.0  5.0  4.3  2.6  1.1  10.1  8.7  6.9  6.4  17.0  41.1  0.0  0.0  119.3  160.3


             Table 3-2E Overlying Producer - Summary of Production for Calendar Year 2014 (ac-ft)  Jun  May  0.0  6.4  42.8  0.0  48.3  6.4  Annual consumption estimated based on water use by a single farm house and a small bovine population  4.2  1.0  9.0  6.3  15.1  15.3  43.4  34.3  0.0  127.5  114.4  170.9  148.7


                       Apr  0.0  4.7  0.0  4.7   5.9  1.0  7.0  5.4  12.4  29.3  0.0  63.1  92.4 Water Duty Method Used to Estimate Annual Production Water Duty Method Used to Estimate Annual Production Water Duty Method Used to Estimate Annual Production Water Duty Method Used to Estimate Annual Production Water Duty Method Used to Estimate Annual Production Water Duty Method Used to Estimate Annual Production Water Duty Method Used to Estimate Annual Production Water Duty Method Us


                       Mar  0.0  3.3  0.0  3.3 Water Duty Method Used to Estimate Annual Production  3.4  0.9 Water Duty Method Used to Estimate Annual Production  4.9  4.3  9.2  20.1  0.0  34.6  54.7  6.- Formerly known as the East Valley Golf Course; prior to that known as the Southern California Section of the PGA of America.  Actual monthly production provided by the Morongo Band of Mission Indians - March 2015

                       Feb  0.9  2.0  16.9  18.9  3.2  0.9  4.0  3.7  7.7  15.9  0.0  30.0  45.8


                       Jan  0.0  0.0  28.7  28.7  2.7  0.9  5.1  4.8  9.9  24.0  0.0  55.4  79.4

                    Metered  Yes  Yes  Yes  No  No  No  No  Yes  Yes  No  Yes  Yes  Yes  Yes  Yes  No  No  No  No  No  No  No  No 1.- All values rounded and subject to revision based on receipt of more accurate information in the future. 5.- Monthly production since 2011 provided by Clearwater Solutions, a company in charge of operating the water system.


                    Owner and Well Name  California Oak Valley Golf and Resort LLC  (3)  Rancho Calimesa Mobile Home Park Roman Catholic Bishop of San Bernardino Sharondale Mesa Owners Association  (5)  Stearns, Leonard M. and Dorothy D. Sunny-Cal Egg and Poultry Company  2.- Total production is estimated for Overlying parties with un-metered wells. 3.- Monthly production provided by BCVWD - Feb 2015 4.- Estimated production based on field visit conducted in April 2015.


                          Beckman, Walter M.  (3)     Oak Valley #1     Oak Valley #2  Subtotal  Merlin Properties  Oak Valley Partners, LP  (4)      Singleton Ranch #5      Singleton Ranch #7      Irrigation Stokes  Subtotal  Plantation on the Lake LLC  (3)      Well No.1      Well No.2  Subtotal  Tukwet Canyon Golf Club  (6)      Well A      Well C      Well D  Subtotal  Albor Properties III, LP  Nikodinov, Nick  McAmis, Ronald L.  Aldama, Nicolas and Amalia  Gutierrez, Hector, et