
Page 66 - Beaumont Basin Watermaster - 2015 Annual Report
P. 66
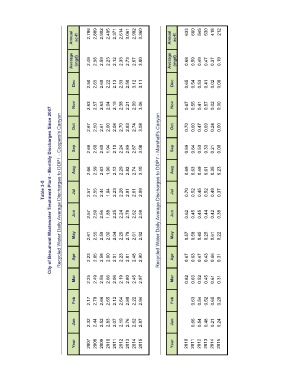
Annual  ac-ft  2,786           2,889           2,902           2,495           2,371           2,614           3,061           2,992           3,360           Annual  ac-ft  633              660              545              530              418              212


                               Average  (mgd)  2.49  2.58  2.59  2.23  2.12  2.33  2.73  2.67  3.00  Average  (mgd)  0.68  0.59  0.49  0.47  0.37  0.19


                                Dec    2.50  2.65  2.69  2.22  2.13  2.33  2.50  3.12  3.11  Dec  0.65  0.54  0.53  0.41  0.02  0.00


                                Nov    2.63  2.57  2.63  2.04  2.19  2.38  2.21  2.99  3.06  Nov  0.67  0.55  0.41  0.57  0.02  0.00


                                Oct    2.67  2.50  2.61  2.00  2.08  2.70  2.83  2.74  3.08  Oct  0.70  0.60  0.47  0.69  0.24  0.00


                                Sep    2.66  2.60  2.60  1.94  2.10  2.24  2.89  2.87  3.08  Sep  0.69  0.64  0.50  0.33  0.21  0.00


                                Aug    2.66  2.59  2.63  1.96  2.13  2.29  2.82  2.74  3.10  Aug  0.69  0.63  0.49  0.61  0.35  0.23


                   Table 3-5 City of Beaumont Wastewater Treatment Plant - Monthly Discharges Since 2007 Recycled Water Daily Average Discharges to DDP1 - Coopers's Canyon  Jul  2.57  2.55  2.44  1.94  2.23  2.28  2.81  2.61  2.99 Recycled Water Daily Average Discharges to DDP7 - Marshall's Canyon  Jul  0.70  0.52  0.45  0.52  0.49  0.37


                                Jun    2.57  2.59  2.56  1.88  2.25  2.24  2.78  2.62  2.98  Jun  0.62  0.45  0.45  0.44  0.42  0.38


                                May    2.61  2.55  2.59  2.00  2.04  2.29  2.78  2.61  2.92  May  0.57  0.58  0.45  0.25  0.61  0.22


                                Apr    2.23  2.65  2.58  2.60  2.01  2.23  2.81  2.48  2.90  Apr  0.67  0.63  0.47  0.43  0.66  0.31


                                Mar    2.25  2.49  2.56  2.66  2.06  2.19  2.80  2.45  2.97  Mar  0.82  0.63  0.52  0.45  0.61  0.31


                                Feb    2.17  2.79  2.66  2.65  2.12  2.64  2.80  2.22  2.94  Feb  0.63  0.54  0.52  0.65  0.20


                                Jan    2.32  2.44  2.52  2.83  2.07  2.19  2.76  2.62  2.87  Jan  0.66  0.54  0.48  0.21  0.24


                                Year   2007  2008  2009  2010  2011  2012  2013  2014  2015  Year  2010  2011  2012  2013  2014  2015