
Page 54 - Beaumont Basin Watermaster - DRAFT 2016 Annual Report
P. 54
32.5 776.6 197.5 335.1 0.0 0.0 1,341.7 3,687.3 461.7 0.0 535.6 153.8 1,473.3 95.1 982.1 2,045.7 1,188.6 1,435.3 1,060.3 0.0 9,431.3 0.0 419.9 419.9 1,576.1 0.0 534.1 534.1 1,638.9 11,727.1 6,902.3
2011
26.8 843.0 51.4 80.0 0.0 142.5 1,143.6 3,885.4 809.1 0.0 775.6 11.9 8.7 381.7 1,930.4 2,199.6 1,300.4 1,312.2 834.4 -142.5 9,421.3 0.0 405.0 405.0 1,591.0 0.0 672.4 672.4 1,500.6 11,642.3 6,977.0
2010
119.8 733.0 472.6 294.8 0.0 474.8 2,095.0 2,934.0 894.1 0.0 1,139.5 452.0 1,784.1 265.1 982.7 2,045.4 1,060.7 1,187.9 797.1 -474.8 10,133.9 0.0 382.2 382.2 1,613.8 0.0 504.4 504.4 1,668.6 13,115.6 6,216.4
2009
382.3 552.5 664.3 583.3 0.0 751.3 2,933.6 2,095.4 976.9 0.0 1,310.2 414.9 2,446.1 1,105.3 2,491.7 2,093.1 127.6 495.9 -751.3 10,710.5 0.0 470.9 470.9 1,525.2 3.2 568.8 572.0 1,601.0 14,687.0 5,221.5
2008
Water Production by Well (ac-ft/yr) (1)
288.1 511.6 673.9 726.0 0.0 572.9 2,772.6 2,256.4 1,283.8 0.0 1,357.3 348.3 2,424.7 1,056.8 3,018.3 2,467.1 -572.9 11,383.3 0.0 665.8 665.8 1,330.2 163.8 1,519.1 1,682.9 490.1 16,504.6 4,076.7
2007
6.8 235.3 276.8 671.9 0.0 636.7 1,827.5 3,201.5 1,149.1 0.0 749.7 537.7 1,996.3 1,062.6 1,963.9 2,231.7 -636.7 9,054.1 0.0 616.0 616.0 1,380.0 220.0 1,807.2 2,027.3 145.7 13,524.9 4,727.2
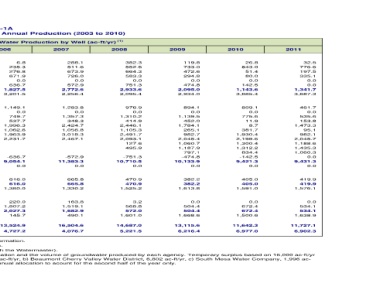
Table 3-1A Appropriator Producer - Summary of Annual Production (2003 to 2010) 2006 4.- Volume of water available for storage is equal to the positive difference between the temporary surplus allocation and the volume of groundwater produced by each agency. Temporary surplus based on 16,000 ac-ft/yr allocated from Fiscal Year 2004 to Fiscal Year 2013. Annual allocation is as follows: a) City of Banning, 5,029 ac-ft/yr, b) Beaumont Cherry Valley Water Distric
0.4 521.2 387.8 532.8 0.0 366.4 1,808.6 3,220.4 1,244.2 117.6 841.6 735.6 2,299.5 405.7 1,747.9 -366.4 7,025.6 0.0 663.2 663.2 1,332.8 117.5 1,163.7 1,281.3 891.7 10,778.6 5,445.0
2005 ft/yr, and d) Yucaipa Valley Water District, 2,173 ac-ft/yr. Allocations for 2003 are based on 50 percent of the annual allocation to acount for the second half of the year only.
710.7 1,026.6 1,135.7 169.8 0.0 354.5 3,397.3 1,631.7 978.3 1,628.2 936.0 1,103.7 1,252.5 1,125.3 204.3 -354.5 6,873.9 0.0 482.5 482.5 1,513.5 226.3 1,607.4 1,833.7 339.3 12,587.4 3,484.5
2004 3.- Pursuant to Part I, Paragraph 3 B of the Judgment, and a separate Agreement (a copy of which is on file with the Watermaster).
619.2 517.7 448.3 525.7 63.3 0.0 2,174.2 340.3 5.9 960.2 675.1 554.6 832.8 483.3 0.0 0.0 3,511.9 0.0 223.2 223.2 774.8 58.9 1,103.5 1,162.4 0.0 7,071.7 1,115.1 1.- Calendar Year Production. All values rounded and subject to revision based on receipt of more accurate information. 2.- 2003 Production only includes from July to December to account for first half of Fiscal Year 2004 Production.
2003 (2)
Owner & Well Name Eligible for Storage (4) Beaumont Cherry Valley Water District Eligible for Storage (4) South Mesa Water Company Eligible for Storage (4) Yucaipa Valley Water District Eligible for Storage (4)
Banning, City of Well C2-A Well C3 Well C4 Well M3 Well M9 From BCVWD (3) Annual Production Well 1 Well 2 Well 3 Well 16 Well 21 Well 22 Well 23 Well 24 Well 25 Well 26 Well 29 To Banning (3) Annual Production 3rd No. 4 Well Annual Production Well 35 Well 48 Annual Production Annual Production Eligible for Storage