
Page 56 - Beaumont Basin Watermaster - DRAFT 2016 Annual Report
P. 56
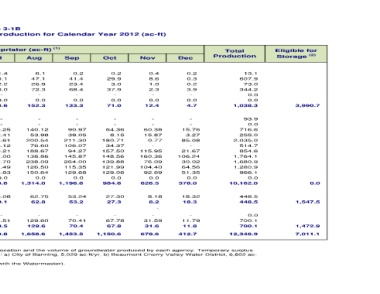
Eligible for   Storage  (2)  3,990.7                   0.0     1,547.5   1,472.9  7,011.1


                       Total   Production  13.1  607.9  73.0  344.2  0.0  0.0  1,038.3  93.9  0.0  716.6  255.0  2,035.0  514.7  854.6  1,764.1  1,680.9  1,280.9  966.1  0.0  10,162.0  448.5  448.5  0.0  700.1  700.1  12,348.9


                          Dec   0.2  0.3  0.2  3.9  -             0.0  4.7  -             -             15.76          3.27           85.08          -             21.67          106.24        30.02          64.56          51.35          0.0  378.0  18.32          18.3  -             11.79          11.8  412.7


                          Nov   0.4  8.6  1.0  2.3  -             0.0  12.4  -             -             60.38          15.87          0.77           -             115.95        160.36        76.09          104.40        92.69          0.0  626.5  8.18            8.2  `  -             31.59          31.6  678.6


                          Oct   0.2  29.9  3.0  37.9  -             0.0  71.0  -             -             64.36          8.15           180.71        34.37          157.50        148.56        139.88        121.99        129.06        0.0  984.6  27.30          27.3  -             67.78          67.8  1,150.6


                          Sep   0.2  41.4  23.4  68.4  -             0.0  133.3  -             -             90.97          39.05          211.30        106.07        94.27          145.87        264.00        115.35        129.68        0.0  1,196.6  53.24          53.2  -             70.41          70.4  1,453.5


                      Water Production by Appropriator (ac-ft)  (1)


                          Aug   6.1  47.1  26.9  72.3  -             0.0  152.3  -             -             140.12        53.98          200.54        76.60          188.67        138.86        238.09        126.50        150.64        0.0  1,314.0  62.75          62.8  -             129.60        129.6  1,658.6


              Table 3-1B  Appropriator Producer - Summary of Production for Calendar Year 2012 (ac-ft)  Jul  1.4  20.1  2.2  80.0  -             0.0  103.6  -             -             150.25        72.41          216.61        136.12        40.21          207.00        257.70        131.49        156.83        0.0  1,368.6  69.08          69.1  -             108.51        108.5  1,649.8


                          Jun   0.7  25.9  13.3  76.1  -             0.0  116.1  18.84          -             130.94        45.11          209.22        141.42        1.04            185.79        245.35        147.78        138.76        0.0  1,264.3  70.07          70.1  -             100.79        100.8  1,551.2 2.- Volume of water available for storage is equal to the positive difference between the temporary surplus allocation and the volume of groundwater produced by each agenc


                          May   0.3  107.5  1.0  0.6  -             0.0  109.5  72.03          -             60.85          17.17          205.19        18.64          -             107.88        222.76        147.45        85.06          0.0  937.0  41.79          41.8  -             76.94          76.9  1,165.3


                          Apr   2.3  85.2  0.2  1.4  -             0.0  89.1  3.02            -             2.99            -             174.32        -             28.94          155.98        78.74          54.20          30.41          0.0  528.6  23.22          23.2  -             37.39          37.4  678.4 3.- Pursuant to Part I, Paragraph 3 B of the Judgment, and a separate Agreement (a copy of which is on file with the Watermaster).


                          Mar   0.4  64.5  0.4  0.5  -             0.0  65.8  -             -             -             0.01            193.32        -             82.69          124.45        -             76.80          -             0.0  477.3  23.13          23.1  -             19.00          19.0  585.2 ft/yr, c) South Mesa Water Company, 1,996 ac-ft/yr, and d) Yucaipa Valley Water District, 2,173 ac-ft/yr.


                          Feb   0.4  82.2  0.7  0.2  -             0.0  83.4  -             -             -             -             165.40        1.50            99.04          139.27        27.80          93.20          -             0.0  526.2  23.65          23.7  -             39.11          39.1  672.4 1.- All values rounded and subject to revision based on receipt of more accurate information


                          Jan   0.5  95.4  0.7  0.6  0.0  97.1 Beaumont Cherry Valley Water District  -             -             -             -             192.55        -             24.66          143.87        100.50        97.20          1.59            0.0  560.4  27.77          27.8  -             7.19            7.2  692.5


                       Owner &  Well Name  Banning, City of  Well C2-A  Well C3  Well C4  Well M3  Well M9 From BCVWD  (3)  Subtotal  Well 1  Well 2  Well 3  Well 16  Well 21  Well 22  Well 23  Well 24  Well 25  Well 26  Well 29 To Banning  (3)  Subtotal South Mesa Water Company 3rd No. 4 Well  Subtotal Yucaipa Valley Water District  Well 35  Well 48  Subtotal  Total