
Page 60 - Beaumont Basin Watermaster - DRAFT 2016 Annual Report
P. 60
Total Production 530.5 526.8 857.7 670.0 0.0 0.0 2,585.1 6.9 0.0 1,281.8 182.2 2,560.7 1.0 1,081.0 1,066.7 2,386.8 521.9 1,716.5 0.0 10,805.5 473.7 473.7 0.0 1,198.5 1,198.5 15,062.8
0.3 5.2 0.2 0.4 0.0 0.0 6.0 0.0 0.0 15.6 7.8 174.4 0.0 103.3 5.9 2.4 93.3 65.2 0.0 467.8 19.04 19.0 0.0 39.9 39.9 532.8
Dec
Nov 29.4 41.3 47.7 0.0 0.0 0.0 118.4 0.0 0.0 85.1 20.7 177.6 0.0 165.2 108.7 26.3 89.8 120.1 0.0 793.6 33.22 33.2 ` 0.0 117.9 117.9 1,063.1
Oct 15.6 49.2 114.5 69.4 0.0 0.0 248.7 0.0 0.0 122.2 51.3 212.5 0.0 90.6 147.6 170.9 123.2 158.4 0.0 1,076.7 45.88 45.9 0.0 156.6 156.6 1,527.9
9.2 46.7 118.1 92.0 0.0 0.0 265.9 0.0 0.0 135.0 45.5 211.4 0.0 92.7 86.1 188.3 142.3 172.3 0.0 54.69 54.7 0.0 127.9 127.9
Sep 1,073.7 1,522.2
Aug 52.3 61.9 103.3 37.7 0.0 0.0 255.2 0.0 0.0 124.1 35.1 262.8 0.0 133.9 0.0 285.9 55.6 180.6 0.0 1,078.1 46.55 46.6 0.0 108.9 108.9 1,488.8
71.2 73.0 110.1 29.3 0.0 0.0 283.6 0.0 0.0 192.3 0.0 283.3 0.0 211.0 2.4 372.6 0.0 210.9 0.0 56.87 56.9 0.0 136.5 136.5
Jul 1,272.5 1,749.4
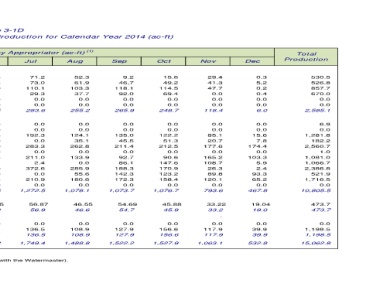
Table 3-1D Appropriator Producer - Summary of Production for Calendar Year 2014 (ac-ft) Water Production by Appropriator (ac-ft) (1) Jun 71.3 66.8 112.9 68.4 0.0 0.0 319.4 0.0 0.0 161.8 0.0 242.0 0.0 208.3 94.1 279.0 0.0 198.3 0.0 1,183.5 50.25 50.3 0.0 127.1 127.1 1,680.2
May 73.1 58.6 124.4 26.2 0.0 0.0 282.2 0.0 0.0 143.4 0.0 231.5 0.0 76.2 110.0 259.9 0.3 172.9 0.0 994.3 38.34 38.3 0.0 96.6 96.6 1,411.5
Apr 87.4 26.9 39.4 80.2 0.0 0.0 233.9 6.9 0.0 140.9 0.0 170.1 0.0 0.0 104.6 234.7 9.1 128.1 0.0 794.4 30.32 30.3 0.0 143.3 143.3 1,201.9
Mar 93.5 2.4 21.2 96.7 0.0 0.0 213.9 0.0 0.0 72.5 0.0 184.3 0.8 0.0 128.0 175.4 8.2 102.0 0.0 671.3 56.87 56.9 0.0 81.7 81.7 1,023.8 2.- Pursuant to Part I, Paragraph 3 B of the Judgment, and a separate Agreement (a copy of which is on file with the Watermaster).
Beaumont Cherry Valley Water District
Feb 26.3 26.7 1.5 71.4 0.0 0.0 125.9 0.0 0.0 81.4 0.0 181.2 0.0 0.0 80.7 164.1 0.0 88.7 0.0 596.1 24.26 24.3 0.0 57.0 57.0 803.4 1.- All values rounded and subject to revision based on receipt of more accurate information
0.9 68.2 64.1 98.4 0.0 0.0 231.7 0.0 0.0 7.4 21.7 229.5 0.1 0.0 198.6 227.3 0.0 119.0 0.0 803.6 17.43 17.4 0.0 5.1 5.1
Jan 1,057.8
Owner & Well Name Banning, City of Well C2-A Well C3 Well C4 Well M3 Well M9 From BCVWD (3) Subtotal Well 1 Well 2 Well 3 Well 16 Well 21 Well 22 Well 23 Well 24 Well 25 Well 26 Well 29 To Banning (2) Subtotal South Mesa Water Company 3rd No. 4 Well Subtotal Yucaipa Valley Water District Well 35 Well 48 Subtotal Total