
Page 88 - Beaumont Basin Watermaster - DRAFT 2016 Annual Report
P. 88
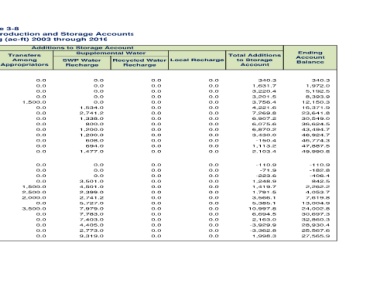
Ending   Account   Balance  340.3  1,972.0  5,192.5  8,393.9  12,150.3  16,371.9  23,641.8  30,549.0  36,624.5  43,494.7  46,924.7  46,774.3  47,887.5  49,990.8  -110.9  -182.8  -406.4  842.5  2,262.2  4,053.7  7,619.8  13,004.9  24,002.8  30,697.3  32,860.3  28,930.4  25,567.6  27,565.9


                         Total Additions   to Storage   Account  340.3  1,631.7  3,220.4  3,201.5  3,756.4  4,221.6  7,269.8  6,907.2  6,075.6  6,870.2  3,430.0  -150.4  1,113.2  2,103.4  -110.9  -71.9  -223.6  1,248.9  1,419.7  1,791.5  3,566.1  5,385.1  10,997.8  6,694.5  2,163.0  -3,929.9  -3,362.8  1,998.3


                          Local Recharge  0.0  0.0  0.0  0.0  0.0  0.0  0.0  0.0  0.0  0.0  0.0  0.0  0.0  0.0  0.0  0.0  0.0  0.0  0.0  0.0  0.0  0.0  0.0  0.0  0.0  0.0  0.0  0.0  0.0  0.0  0.0  0.0  0.0  0.0  0.0  0.0  0.0  0.0  0.0  0.0  0.0  0.0  0.0  0.0  0.0  0.0  0.0  0.0  0.0  0.0  0.0  0.0  0.0  0.0  0.0  0.0


                        Supplemental Water Additions to Storage Account  Recycled Water  SWP Water   Recharge Recharge  0.0  0.0  0.0  0.0  0.0  1,534.0  2,741.2  1,338.0  800.0  1,200.0  1,200.0  608.0  694.0  1,477.0  0.0  0.0  0.0  3,501.0  4,501.0  2,399.0  2,741.2  5,727.0  7,979.0  7,783.0  7,403.0  4,405.0  2,773.0  9,319.0


                         Transfers   Among  Appropriators  0.0  0.0  0.0  0.0  1,500.0  0.0  0.0  0.0  0.0  0.0  0.0  0.0  0.0  0.0  0.0  0.0  0.0  0.0  1,500.0  2,500.0  2,000.0  0.0  3,500.0  0.0  0.0  0.0  0.0  0.0


              Table 3-8 Consolidation of Appropriator Production and Storage Accounts Calendar Year Accounting (ac-ft) 2003 through 2016


                        Unused   Overlying  Production   Allocation  0.0  0.0  0.0  0.0  0.0  592.2  1,594.7  1,683.8  1,588.2  1,679.5  1,816.1  1,826.7  2,097.5  2,099.1  0.0  0.0  0.0  0.0  0.0  801.0  2,156.8  2,277.4  2,148.1  2,271.5  2,456.4  2,470.6  2,836.9  2,839.1


                         Under / Over Production  (1)  340.3  1,631.7  3,220.4  3,201.5  2,256.4  2,095.4  2,934.0  3,885.4  3,687.3  3,990.7  413.8  -2,585.1  -1,678.3  -1,472.7  -110.9  -71.9  -223.6  -2,252.1  -4,581.3  -3,908.5  -3,331.9  -2,619.3  -2,629.3  -3,360.0  -7,696.4  -10,805.5  -8,972.8  -10,159.8


                       Groundwater  Production for   CY  2,174.2  3,397.3  1,808.6  1,827.5  2,772.6  2,933.6  2,095.0  1,143.6  1,341.7  1,038.3  2,100.7  2,585.1  1,678.3  1,472.7  3,511.9  6,873.9  7,025.6  9,054.1  11,383.3  10,710.5  10,133.9  9,421.3  9,431.3  10,162.0  11,097.4  10,805.5  8,972.8  10,159.8


                        Share of  Surplus Water  2,514.5  5,029.0  5,029.0  5,029.0  5,029.0  5,029.0  5,029.0  5,029.0  5,029.0  5,029.0  2,514.5  0.0  0.0  0.0 Beaumont Cherry Valley Water District - Authorized Storage Account: 80,000 ac-ft  3,401.0  6,802.0  6,802.0  6,802.0  6,802.0  6,802.0  6,802.0  6,802.0  6,802.0  6,802.0  3,401.0  0.0  0.0  0.0


                     Storage   Account   Balance at   Beginning   of CY City of Banning - Authorized Storage Account: 80,000 ac-ft  0.0  340.3  1,972.0  5,192.5  8,393.9  12,150.3  16,371.9  23,641.8  30,549.0  36,624.5  43,494.7  46,924.7  46,774.3  47,887.5  0.0  -110.9  -182.8  -406.4  842.5  2,262.2  4,053.7  7,619.8  13,004.9  24,002.8  30,697.3  32,860.3  28,930.4  25,567.6


                         Calendar Year  2003  2004  2005  2006  2007  2008  2009  2010  2011  2012  2013  2014  2015  2016  2003  2004  2005  2006  2007  2008  2009  2010  2011  2012  2013  2014  2015  2016