
Page 94 - Beaumont Basin Watermaster - DRAFT 2016 Annual Report
P. 94
In the South Beaumont Basin, the maximum TDS concentration ranged from 220 to 780 mg/L
and averaged 510 mg/L. The average TDS concentration for all samples in this area was 475
mg/L.
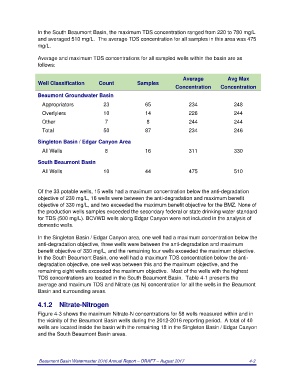
Average and maximum TDS concentrations for all sampled wells within the basin are as
follows:
Average Avg Max
Well Classification Count Samples
Concentration Concentration
Beaumont Groundwater Basin
Appropriators 23 65 234 248
Overlyiers 10 14 226 244
Other 7 8 244 244
Total 50 87 234 246
Singleton Basin / Edgar Canyon Area
All Wells 8 16 311 330
South Beaumont Basin
All Wells 10 44 475 510
Of the 33 potable wells, 15 wells had a maximum concentration below the anti-degradation
objective of 230 mg/L, 16 wells were between the anti-degradation and maximum benefit
objective of 330 mg/L, and two exceeded the maximum benefit objective for the BMZ. None of
the production wells samples exceeded the secondary federal or state drinking water standard
for TDS (500 mg/L). BCVWD wells along Edgar Canyon were not included in the analysis of
domestic wells.
In the Singleton Basin / Edgar Canyon area, one well had a maximum concentration below the
anti-degradation objective, three wells were between the anti-degradation and maximum
benefit objective of 330 mg/L, and the remaining four wells exceeded the maximum objective.
In the South Beaumont Basin, one well had a maximum TDS concentration below the anti-
degradation objective, one well was between this and the maximum objective, and the
remaining eight wells exceeded the maximum objective. Most of the wells with the highest
TDS concentrations are located in the South Beaumont Basin. Table 4-1 presents the
average and maximum TDS and Nitrate (as N) concentration for all the wells in the Beaumont
Basin and surrounding areas.
4.1.2 Nitrate-Nitrogen
Figure 4-3 shows the maximum Nitrate-N concentrations for 58 wells measured within and in
the vicinity of the Beaumont Basin wells during the 2012-2016 reporting period. A total of 40
wells are located inside the basin with the remaining 18 in the Singleton Basin / Edgar Canyon
and the South Beaumont Basin areas.
Beaumont Basin Watermaster 2016 Annual Report – DRAFT – August 2017 4-2