
Page 140 - Beaumont Basin Watermaster
P. 140
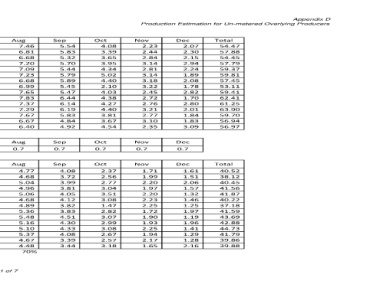
Production Estimation for Un-metered Overlying Producers
         Appendix D


                  Total  54.47  57.88  54.45  57.79  59.37  59.81  57.45  53.11  59.41  62.41  61.25  63.90  59.70  56.94  56.97  Total  40.52  38.12  40.45  41.56  41.87  40.22  37.18  41.59  43.69  42.88  44.73  41.79  39.86  39.88


                     2.07  2.30  2.15  2.94  2.24  1.89  2.08  1.78  2.82  1.70  2.80  2.01  1.84  1.83  3.09  1.61  1.51  2.06  1.57  1.32  1.46  1.25  1.97  1.19  1.96  1.41  1.29  1.28  2.16
                  Dec                                        Dec  0.7  Dec


                     2.23  2.44  2.84  3.14  2.81  3.14  3.18  3.22  2.45  2.72  2.76  3.21  2.77  3.10  2.35  1.71  1.99  2.20  1.97  2.20  2.23  2.25  1.72  1.90  1.93  2.25  1.94  2.17  1.65
                  Nov                                        Nov  0.7  Nov


                     4.08  3.39  3.65  3.95  4.34  5.02  4.40  2.10  4.03  4.38  4.27  4.40  3.81  3.67  4.54  2.37  2.56  2.77  3.04  3.51  3.08  1.47  2.82  3.07  2.99  3.08  2.67  2.57  3.18

                  Oct                                        Oct  0.7  Oct


                     5.54  5.83  5.32  5.70  5.44  5.79  5.89  5.45  5.47  6.44  6.14  6.19  5.83  4.84  4.92  4.08  3.72  3.99  3.81  4.05  4.12  3.82  3.83  4.51  4.30  4.33  4.08  3.39  3.44

                  Sep                                        Sep  0.7  Sep


                     7.46  6.81  6.68  7.20  7.09  7.23  6.68  6.99  7.65  7.83  7.37  7.29  7.67  6.67  6.40  4.77  4.68  5.04  4.96  5.06  4.68  4.89  5.36  5.48  5.16  5.10  5.37  4.67  4.48  70%
                  Aug                                        Aug  0.7  Aug
                                                                                                                                                                                                                                                                                          Page 1 of 7


                     7.05  7.55  7.28  7.73  7.57  7.53  7.60  6.57  7.76  7.93  7.13  7.76  6.76  7.26  7.11  5.29  5.10  5.41  5.30  5.27  5.32  4.60  5.43  5.55  4.99  5.43  4.73  5.08  4.98

                  Jul                                        Jul  0.7  Jul


                     5.16  6.50  6.49  7.16  7.16  7.59  5.37  6.25  6.95  7.62  7.36  7.62  7.42  6.95  6.98  4.55  4.54  5.01  5.01  5.31  3.76  4.38  4.87  5.33  5.15  5.33  5.19  4.87  4.89 Irrigation Efficienty:

                  Jun                                        Jun  0.7  Jun


                     5.65  7.10  6.47  6.02  6.47  6.28  6.32  6.18  6.67  7.00  7.01  7.65  5.38  5.34  5.95  4.97  4.53  4.21  4.53  4.40  4.42  4.33  4.67  4.90  4.91  5.36  3.77  3.74  4.17
                  May                                                                                                                                         May  0.7  May


                Monthly Evapotranspiration Values ‐ 2002 through 2016
                     5.00  5.90  5.41  4.26  5.04  6.04  5.58  5.11  5.57  5.85  5.71  6.52  6.30  6.00  6.13  4.13  3.79  2.98  3.53  4.23  3.91  3.58  3.90  4.10  4.00  4.56  4.41  4.20  4.29

                  Apr                                        Apr  0.7  Apr
              University of California Riverside ‐ CIMIS Station 44


                     4.61  4.81  3.93  3.42  5.02  5.30  4.62  4.67  4.22  4.51  4.80  4.95  5.83  4.91  5.01  3.37  2.75  2.39  3.51  3.71  3.23  3.27  2.95  3.16  3.36  3.47  4.08  3.44  3.51
                  Mar                                        Mar  0.7  Mar                                ac‐ft/yr/du
                                                                                                                                                                                                                                                                                                                                                   Beaumont Basin Watermaster 2017 Annual Report - DRAFT - February 2018


                     2.57  2.76  2.21  3.35  2.91  2.31  2.41  2.44  2.91  3.41  3.18  3.03  3.33  4.28  2.08  1.93  1.55  2.35  2.04  1.62  1.69  1.71  2.04  2.39  2.23  2.12  2.33  3.00  1.46  0.35
                  Feb                                        Feb  0.7  Feb
                                                                                                                                                                                         Crop Coefficient (Warm Season Bermuda Grass)


                     3.05  2.49  2.02  2.92  3.28  1.69  3.32  2.35  2.91  3.02  2.72  3.27  2.76  2.09  2.41  Monthly Water Requirements (inches)  1.74  1.41  2.04  2.30  1.18  2.32  1.65  2.04  2.11  1.90  2.29  1.93  1.46  1.69

                  Jan                                        Jan  0.7  Jan


                  Year  2003  2004  2005  2006  2007  2008  2009  2010  2011  2012  2013  2014  2015  2016  2017  Year  Kc  Year  2004  2005  2006  2007  2008  2009  2010  2011  2012  2013  2014  2015  2016  2017 Indoor Water Use: