
Page 106 - Beaumont Basin Watermaster
P. 106
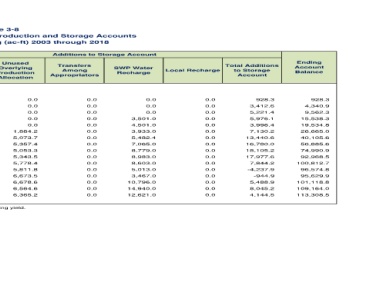
Ending   Account   Balance  928.3  4,340.9  9,562.3  15,538.3  19,534.8  26,665.0  40,105.6  56,885.6  74,990.9  92,968.5  100,812.7  96,574.8  95,629.9  101,118.8  109,164.0  113,308.5


                             Total Additions   to Storage   Account  928.3  3,412.6  5,221.4  5,976.1  3,996.4  7,130.2  13,440.6  16,780.0  18,105.2  17,977.6  7,844.2  -4,237.9  -944.9  5,488.9  8,045.2  4,144.5


                               Local Recharge  0.0  0.0  0.0  0.0  0.0  0.0  0.0  0.0  0.0  0.0  0.0  0.0  0.0  0.0  0.0  0.0


                        Additions to Storage Account
                              SWP Water   Recharge  0.0  0.0  0.0  3,501.0  4,501.0  3,933.0  5,482.4  7,065.0  8,779.0  8,983.0  8,603.0  5,013.0  3,467.0  10,796.0  14,940.0  12,621.0


                             Transfers   Among  Appropriators  0.0  0.0  0.0  0.0  0.0  0.0  0.0  0.0  0.0  0.0  0.0  0.0  0.0  0.0  0.0  0.0


              Table 3-8 Consolidation of Appropriator Production and Storage Accounts Calendar Year Accounting (ac-ft) 2003 through 2018  Unused   Overlying  Production   Allocation  0.0  0.0  0.0  0.0  0.0  1,884.2  5,073.7  5,357.4  5,053.3  5,343.5  5,778.4  5,811.8  6,673.5  6,678.6  6,564.6  6,365.2


                              Under / Over Production  (1)  928.3  3,412.6  5,221.4  2,475.1  -504.6  1,313.0  2,884.4  4,357.7  4,272.9  3,651.1  -6,537.2  -15,062.8  -11,087.4  -11,989.7  -13,462.4  -14,845.7


                              Production   7,071.7  12,587.4  10,778.6  13,524.9  16,504.6  14,687.0  13,115.6  11,642.3  11,727.1  12,348.9  14,537.2  15,062.8  11,087.4  11,989.7  13,462.4  15,026.1


                             Appropriative   Rights  0.0  0.0  0.0  0.0  0.0  0.0  0.0  0.0  0.0  0.0  0.0  0.0  0.0  0.0  0.0  180.4 1 -- Negative values of under production indicate that the appropriator pumped more than its share of the operating yield.


                             Share of  Surplus Water  8,000.0  16,000.0  16,000.0  16,000.0  16,000.0  16,000.0  16,000.0  16,000.0  16,000.0  16,000.0  8,000.0  0.0  0.0  0.0  0.0  0.0


                          Storage   Account   Balance at   Beginning   of CY  0.0  928.3  4,340.9  9,562.3  15,538.3  19,534.8  26,665.0  40,105.6  56,885.6  74,990.9  92,968.5  100,812.7  96,574.8  95,629.9  101,118.8  109,164.0


                             Calendar   Year  Totals  2003  2004  2005  2006  2007  2008  2009  2010  2011  2012  2013  2014  2015  2016  2017  2018