
Page 110 - Beaumont Basin Watermaster
P. 110
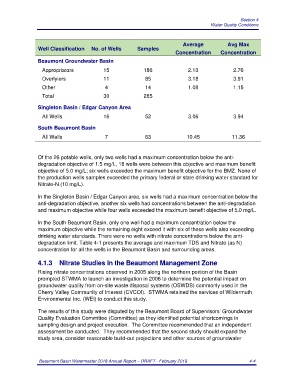
Section 4
                                                                                         Water Quality Conditions


                                                                             Average            Avg Max
                 Well Classification   No. of Wells       Samples
                                                                          Concentration      Concentration
                 Beaumont Groundwater Basin

                   Appropriators            15               186                2.13              2.76
                   Overlyiers               11                85                3.18               3.91
                   Other                     4                14                1.08               1.15
                   Total                    30               285

                 Singleton Basin / Edgar Canyon Area

                   All Wells                16                52                3.06               3.94

                 South Beaumont Basin

                   All Wells                 7                63               10.45              11.36


                 Of the 26 potable wells, only two wells had a maximum concentration below the anti-
                 degradation objective of 1.5 mg/L, 18 wells were between this objective and maximum benefit
                 objective of 5.0 mg/L; six wells exceeded the maximum benefit objective for the BMZ. None of
                 the production wells samples exceeded the primary federal or state drinking water standard for
                 Nitrate-N (10 mg/L).

                 In the Singleton Basin / Edgar Canyon area, six wells had a maximum concentration below the
                 anti-degradation objective, another six wells had concentrations between the anti-degradation
                 and maximum objective while four wells exceeded the maximum benefit objective of 5.0 mg/L.

                 In the South Beaumont Basin, only one well had a maximum concentration below the
                 maximum objective while the remaining eight exceed it with six of these wells also exceeding
                 drinking water standards. There were no wells with nitrate concentrations below the anti-
                 degradation limit. Table 4-1 presents the average and maximum TDS and Nitrate (as N)
                 concentration for all the wells in the Beaumont Basin and surrounding areas.


                 4.1.3  Nitrate Studies in the Beaumont Management Zone
                 Rising nitrate concentrations observed in 2005 along the northern portion of the Basin
                 prompted STWMA to launch an investigation in 2006 to determine the potential impact on
                 groundwater quality from on-site waste disposal systems (OSWDS) commonly used in the
                 Cherry Valley Community of Interest (CVCOI).  STWMA retained the services of Wildermuth
                 Environmental Inc. (WEI) to conduct this study.

                 The results of this study were disputed by the Beaumont Board of Supervisors’ Groundwater
                 Quality Evaluation Committee (Committee) as they identified potential shortcomings in
                 sampling design and project execution.  The Committee recommended that an independent
                 assessment be conducted.  They recommended that the second study should expand the
                 study area, consider reasonable build-out projections and other sources of groundwater


                  Beaumont Basin Watermaster 2018 Annual Report – DRAFT - February 2019                  4-4