
Page 33 - Beaumont Basin Watermaster
P. 33
Section 3
Water Quality Conditions
(spreading) and extractions (pumping) are easily quantifiable, losses from storage are more
difficult to estimate. The completion of the “Beaumont Basin Storage Loss Analysis” in
September 2018 estimates storage losses under various spreading scenarios; however,
Watermaster has not develop a methodology to adjust storage accounts and their
corresponding losses.
3.5.1 Annual Storage Consolidation
Consistent with the new reporting format to document extractions, spreading and other
groundwater activities on a calendar year basis, Table 3-8 represents the consolidation of
each Appropriator’s storage account from CY 2003 through CY 2018. This table includes
annual production by Appropriator, their share of Temporary Surplus, Appropriative rights,
supplemental water recharge in its various forms, transfers between Appropriators, potable
deliveries to parcels previously owned by Overlying Users, and transfers of unused water from
Overlying Users. At the end of 2017, an overall total of 109,164 ac-ft of water were stored in
the Basin for future use; this total increased in CY 2018 by 4,114.50 ac-ft to a cumulative total
of 113,308.50 ac-ft. Increased spreading of imported water by BCVWD and the City of
Banning along with newly acquired Appropriative rights by YVWD were the primary reasons
for the increase in storage. Despite of the expiration of the Temporary Surplus allocation at
the end of CY 2013, the amount of water in storage at the end of CY 2018 was 12,496 ac-ft
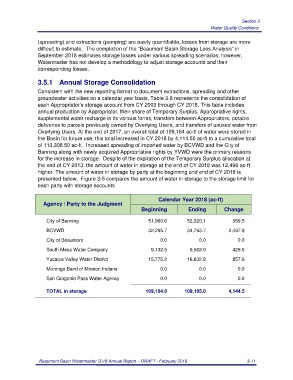
higher. The amount of water in storage by party at the beginning and end of CY 2018 is
presented below. Figure 3-5 compares the amount of water in storage to the storage limit for
each party with storage accounts
Calendar Year 2018 (ac-ft)
Agency / Party to the Judgment
Beginning Ending Change
City of Banning 51,960.6 52,320.1 359.5
BCVWD 32,295.7 34,793.7 2,497.9
City of Beaumont 0.0 0.0 0.0
South Mesa Water Company 9,132.5 9,562.0 429.5
Yucaipa Valley Water District 15,775.2 16,632.8 857.6
Morongo Band of Mission Indians 0.0 0.0 0.0
San Gorgonio Pass Water Agency 0.0 0.0 0.0
TOTAL in storage 109,164.0 109,165.0 4,144.5
Beaumont Basin Watermaster 2018 Annual Report – DRAFT - February 2019 3-11