
Page 54 - Beaumont Basin Watermaster
P. 54
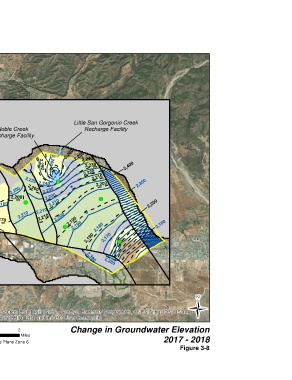
Little San Gorgonio Creek
 Noble Creek                        Recharge Facility
 ! (  2,160  Recharge Facility


 2,100  2,160
 1,940                       2,260
 ! (                   2,260     2,250 2,240
                                     2,230           2,400
                                    2,220
                  2,250
 Map Features  2,100                    2,210
 2017 to 2018 Groundwater  2,220  2,240  ! (  2,200       2,300
 Elevation Change (ft)  ! (  2,200  2,200  2,230
 30 to 40
      2,200         2,220                 ! ( ! ( ! ( ! (
 20 to 30  2,160  ! (  2,210                                   2,200
 15 to 20  2,160
 10 to 15  2,210  2,210
 5 to 10  2,170  2,210  2,200  2,190
 1 to 5                    ! (  2,190    2,180                     2,100
 -1 to 1
 -1 to -5                            2,180  2,170
 -5 to -10                                        ! (
 -10 to -15
 -15 to -20                          2,390
 Dec 2018 Groundwater Elevation              2,380
 (ft amsl; interval = 10 ft)
 Dec 2017 Groundwater Elevation
 (ft amsl; interval = 10 ft)
 Fault
 ! ( Well used in Hydrograph Analysis
 Artificial Recharge Facility
 Beaumont Basin                                                                 Ü
 Adjudicated Boundary
  Source: Esri, DigitalGlobe, GeoEye, Earthstar Geographics, CNES/Airbus DS, USDA, USGS,
 AeroGRID, IGN, and the GIS User Community

 Alda, Inc.  in association with  0  0.5  1  2  Change in Groundwater Elevation
          Miles
 NAD 83 CA State Plane Zone 6                                        2017 - 2018
                                                                            Figure 3-8