
Page 76 - Beaumont Basin Watermaster
P. 76
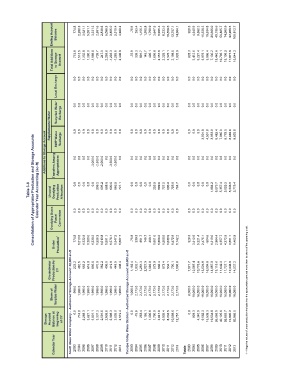
Ending Account   Balance  774.8  2,288.3  3,621.1  5,001.1  3,331.3  2,591.6  2,838.6  5,098.3  3,805.0  2,519.4  4,928.2  -75.9  263.4  1,155.1  1,300.8  1,790.9  3,647.8  6,005.4  8,233.5  10,558.6  12,757.1  14,684.1  928.3  4,340.9  9,562.3  15,538.3  19,534.8  26,665.0  40,105.6  56,885.7  74,990.9  92,968.5  108,812.7


                       Total Additions   to Storage   Account  774.8  1,513.5  1,332.8  1,380.0  -1,669.8  -739.7  247.0  2,259.6  -1,293.3  -1,285.6  2,408.8  -75.9  339.3  891.7  145.7  490.1  1,856.8  2,357.6  2,228.1  2,325.1  2,198.5  1,926.9  928.3  3,412.6  5,221.4  5,976.1  3,996.4  7,130.2  13,440.6  16,780.1  18,105.2  17,977.6  15,844.2


                         Local Recharge  0.0  0.0  0.0  0.0  0.0  0.0  0.0  0.0  0.0  0.0  0.0  0.0  0.0  0.0  0.0  0.0  0.0  0.0  0.0  0.0  0.0  0.0  0.0  0.0  0.0  0.0  0.0  0.0  0.0  0.0  0.0  0.0  0.0  0.0  0.0  0.0  0.0  0.0  0.0  0.0  0.0  0.0  0.0  0.0  0.0  0.0  0.0  0.0  0.0  0.0  0.0  0.0  0.0  0.0  0.0  0.0  0.0  0.0  0.0  0.0  0.0  0.0  0.0  0.0  0.0  0.0


                      Supplemental Water  Recycled Water  SWP Water   Recharge  Recharge  0.0  0.0  0.0  0.0  0.0  0.0  0.0  0.0  0.0  0.0  0.0  0.0  0.0  0.0  0.0  0.0  0.0  0.0  0.0  0.0  0.0  0.0  0.0  0.0  0.0  3,501.0  4,501.0  3,933.0  5,482.4  7,065.0  8,779.0  8,983.0  8,603.0


                    Additions to Storage Account  Transfers Among   Appropriators  0.0  0.0  0.0  0.0  -3,000.0  -2,500.0  -2,000.0  0.0  -3,500.0  -3,500.0  0.0  0.0  0.0  0.0  0.0  0.0  0.0  0.0  0.0  0.0  0.0  0.0  0.0  0.0  0.0  0.0  0.0  0.0  0.0  0.0  0.0  0.0  0.0


             Table 3-8 Consolidation of Appropriator Production and Storage Accounts Calendar Year Accounting (ac-ft)  Unused   Overlying   Production   Allocation  0.0  0.0  0.0  0.0  0.0  0.0  0.0  0.0  0.0  0.0  235.2  0.0  633.2  0.0  668.6  0.0  630.6  0.0  666.9  0.0  721.1  0.0  0.0  0.0  0.0  0.0  0.0  0.0  0.0  0.0  0.0  0.0  255.9  0.0  689.0  0.0  727.5  0.0  686.2  0.0  725.6  0.0  784.7  0.0  0.0  0.0  0.0  0.0  0.0  0.0  0.0  0.0  0.0  0.0  1,884.2  0.0  5,073.7  0.0  5


                        Under  Overlying Users   Parcel   Production 1  Conversion  774.8  1,513.5  1,332.8  1,380.0  1,330.2  1,525.2  1,613.8  1,591.1  1,576.1  1,547.5  1,687.7  -75.9  339.3  891.7  145.7  490.1  1,601.0  1,668.6  1,500.6  1,638.9  1,472.9  1,142.2  928.3  3,412.6  5,221.4  2,475.1  -504.6  1,313.0  2,884.4  4,357.7  4,272.9  3,651.1  1,462.8


                      Groundwater   Production for   CY  223.2  482.5  663.2  616.0  665.8  470.9  382.2  405.0  419.9  448.5  308.4  1,162.4  1,833.7  1,281.3  2,027.3  1,682.9  572.0  504.4  672.4  534.1  700.1  1,030.8  7,071.7  12,587.4  10,778.6  13,524.9  16,504.6  14,687.0  13,115.6  11,642.3  11,727.1  12,348.9  14,537.2


                       Share of   Surplus Water South Mesa Water Company -  Authorized Storage Account: 20,000 ac-ft  998.0  1,996.0  1,996.0  1,996.0  1,996.0  1,996.0  1,996.0  1,996.0  1,996.0  1,996.0  1,996.0 Yucaipa Valley Water District - Authorized Storage Account: 50,000 ac-ft  1,086.5  2,173.0  2,173.0  2,173.0  2,173.0  2,173.0  2,173.0  2,173.0  2,173.0  2,173.0  2,173.0  8,000.0  16,000.0  16,000.0  16,000.0  16,000.0  16,000.0  16,000.0  16,000.0  16,000.0  16,000.0  16


                    Storage   Account   Balance at   Beginning   of CY  0.0  774.8  2,288.3  3,621.1  5,001.1  3,331.3  2,591.6  2,838.6  5,098.3  3,805.0  2,519.4  0.0  -75.9  263.4  1,155.1  1,300.8  1,790.9  3,647.8  6,005.4  8,233.5  10,558.6  12,757.1  0.0  928.3  4,340.9  9,562.3  15,538.3  19,534.8  26,665.0  40,105.6  56,885.7  74,990.9  92,968.5


                        Calendar Year  2003  2004  2005  2006  2007  2008  2009  2010  2011  2012  2013  2003  2004  2005  2006  2007  2008  2009  2010  2011  2012  2013  Totals  2003  2004  2005  2006  2007  2008  2009  2010  2011  2012  2013