
Page 109 - Beaumont Basin Watermaster
P. 109
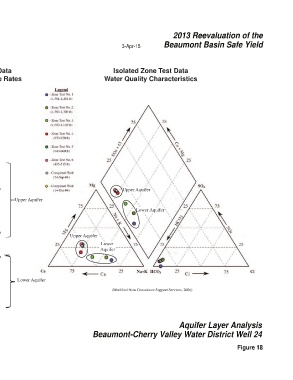
2013 Reevaluation of the
 Beaumont Basin Watermaster                         3-Apr-15         Beaumont Basin Safe Yield


 Flow Meter Data  Isolated Zone Test Data       Isolated Zone Test Data

 Estimated Percent of Flow per Interval  Diagram and Discharge Rates  Water Quality Characteristics
 2,600  0%  10%  20%  30%
 2,594  0

 Pilot
 2,500   100   Borehole

 2,400   200


 2,300   Blank
 Well  300
 Casing
 2,200   400


 2,100   500   Zone 6  83 gpm
 7.0%
 2,000   600
 19.3%  Zone 5  115 gpm                             Upper Aquifer
 Elevation (ft amsl)  1,900   0.0%  8.0% 13.4%  16.0%  Upper Aquifer  Feet Below Ground Surface (ft bgs)  700   Upper Aquifer  Lower Aquifer


 1,800
 800

 1,700   Perforated  8.2%  900
 Well  6.9%
 Casing  Zone 4  120 gpm      Upper Aquifer
 1,600
 1,000                                     Lower
 10.8%                                     Aquifer
 1,500
 1,100   Zone 3  100 gpm
 0.0%
 1,400
 1,200
 Lower Aquifer
 5.7%   Lower Aquifer
 1,300   1,300   Zone 2  52 gpm
                                                (Modified from Geoscience Support Services, 2006)
 4.7%
 1,200
 1,400   Zone 1  60 gpm
 1,100   1,500
                                                                            Aquifer Layer Analysis

                                        Beaumont-Cherry Valley Water District Well 24

                                                                                                    Figure 18