
Page 175 - Beaumont Basin Watermaster
P. 175
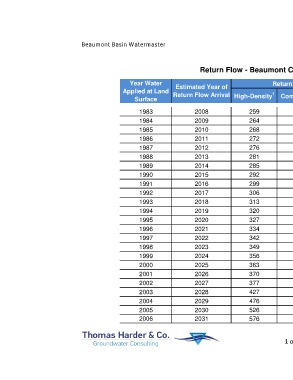
Beaumont Basin Watermaster

                                                                                                                                                                                                     Table D-1


                                                                                     Return Flow - Beaumont Cherry Valley Water District

                                                       Year Water         Estimated Year of                        Return Flow by Land Use Type (acre-ft)

                                                    Applied at Land      Return Flow Arrival                       1                 2                         3                  4      Total
                                                         Surface                                   High-Density       Commercial         Urban Landscape           Low-Density

                                                           1983                   2008                   259                 6                    112                    341              718
                                                           1984                   2009                   264                 6                    115                    347              731

                                                           1985                   2010                   268                 6                    118                    353              745
                                                           1986                   2011                   272                 6                    121                    359              759
                                                           1987                   2012                   276                 6                    124                    366              772

                                                           1988                   2013                   281                 6                    127                    372              786
                                                           1989                   2014                   285                 6                    130                    378              799
                                                           1990                   2015                   292                 6                    133                    379              811

                                                           1991                   2016                   299                 6                    136                    381              822
                                                           1992                   2017                   306                 6                    139                    382              834
                                                           1993                   2018                   313                 7                    142                    384              845

                                                           1994                   2019                   320                 7                    145                    385              857
                                                           1995                   2020                   327                 7                    148                    386              868
                                                           1996                   2021                   334                 7                    151                    388              879

                                                           1997                   2022                   342                 7                    153                    389              891
                                                           1998                   2023                   349                 7                    156                    391              902

                                                           1999                   2024                   356                 7                    159                    392              914
                                                           2000                   2025                   363                 7                    162                    393              925
                                                           2001                   2026                   370                 7                    165                    395              937

                                                           2002                   2027                   377                 7                    168                    396              948
                                                           2003                   2028                   427                 7                    182                    402             1,019
                                                           2004                   2029                   476                 8                    197                    408             1,089

                                                           2005                   2030                   526                 8                    211                    414             1,160
                                                           2006                   2031                   576                 9                    226                    420             1,230


                                                                                                                        1 of 2                                                                          16-Jan-15