
Page 187 - Beaumont Basin Watermaster
P. 187
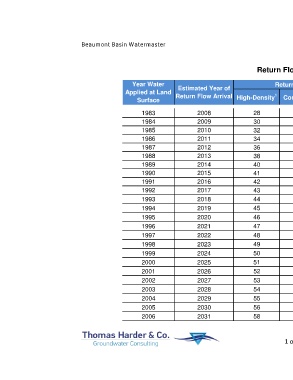
Beaumont Basin Watermaster

                                                                                                                                                                                                     Table D-4


                                                                                                            Return Flow  - Other


                                                        Year Water                                                  Return Flow by Land Use Type (acre-ft)
                                                     Applied at Land       Estimated Year of                        1                 2                         3                  4     Total
                                                          Surface         Return Flow Arrival       High-Density       Commercial         Urban Landscape           Low-Density

                                                            1983                   2008                    28                  2                    35                    13              78
                                                            1984                   2009                    30                  2                    38                    13              83

                                                            1985                   2010                    32                  2                    40                    13              87
                                                            1986                   2011                    34                  2                    43                    14              92
                                                            1987                   2012                    36                  2                    46                    14              97

                                                            1988                   2013                    38                  2                    48                    14              102
                                                            1989                   2014                    40                  2                    51                    14              107
                                                            1990                   2015                    41                  2                    88                    15              146
                                                            1991                   2016                    42                  2                   126                    15              184
                                                            1992                   2017                    43                  2                   164                    15              223

                                                            1993                   2018                    44                  2                   201                    15              261
                                                            1994                   2019                    45                  2                   239                    15              300

                                                            1995                   2020                    46                  2                   276                    15              339
                                                            1996                   2021                    47                 2                    314                    15              377
                                                            1997                   2022                    48                 2                    351                    15              416
                                                            1998                   2023                    49                 2                    389                    15              455

                                                            1999                   2024                    50                 2                    426                    16              493
                                                            2000                   2025                    51                 2                    464                    16              532

                                                            2001                   2026                    52                  2                   501                    16              570
                                                            2002                   2027                    53                  2                   539                    16              609
                                                            2003                   2028                    54                  2                   542                    17              615

                                                            2004                   2029                    55                  2                   546                    18              621
                                                            2005                   2030                    56                  2                   549                    19              627
                                                            2006                   2031                    58                  2                   553                    20              633


                                                                                                                        1 of 2                                                                           3-Apr-15