
Page 28 - Beaumont Basin Watermaster
P. 28
Beaumont Basin Watermaster
2013 Reevaluation of the Beaumont Basin Safe Yield 3-Apr-15
intervals of the wells. For wells with flowmeter test data, the hydraulic conductivity was
apportioned to the individual aquifers based on the measured flow contributions specific to those
wells (see Table 1). For all other wells, the hydraulic conductivity was apportioned to the
individual aquifers based on the assumption that 88 percent of the flow contribution is from the
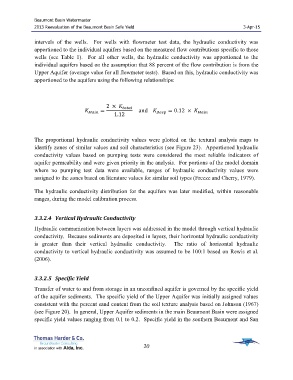
Upper Aquifer (average value for all flowmeter tests). Based on this, hydraulic conductivity was
apportioned to the aquifers using the following relationships:
The proportional hydraulic conductivity values were plotted on the textural analysis maps to
identify zones of similar values and soil characteristics (see Figure 23). Apportioned hydraulic
conductivity values based on pumping tests were considered the most reliable indicators of
aquifer permeability and were given priority in the analysis. For portions of the model domain
where no pumping test data were available, ranges of hydraulic conductivity values were
assigned to the zones based on literature values for similar soil types (Freeze and Cherry, 1979).
The hydraulic conductivity distribution for the aquifers was later modified, within reasonable
ranges, during the model calibration process.
3.3.2.4 Vertical Hydraulic Conductivity
Hydraulic communication between layers was addressed in the model through vertical hydraulic
conductivity. Because sediments are deposited in layers, their horizontal hydraulic conductivity
is greater than their vertical hydraulic conductivity. The ratio of horizontal hydraulic
conductivity to vertical hydraulic conductivity was assumed to be 100:1 based on Rewis et al.
(2006).
3.3.2.5 Specific Yield
Transfer of water to and from storage in an unconfined aquifer is governed by the specific yield
of the aquifer sediments. The specific yield of the Upper Aquifer was initially assigned values
consistent with the percent sand content from the soil texture analysis based on Johnson (1967)
(see Figure 20). In general, Upper Aquifer sediments in the main Beaumont Basin were assigned
specific yield values ranging from 0.1 to 0.2. Specific yield in the southern Beaumont and San
20