Page 141 - Beaumont Basin Watermaster
P. 141

Appendix D
                                                                                    Production Estimation for Un-metered Overlying Producers
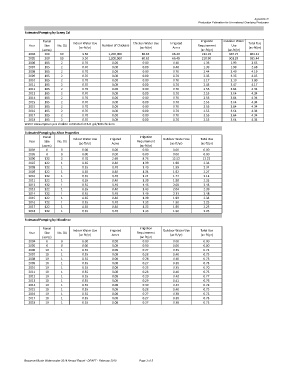
           Estimated Pumping by Sunny Cal
                   Parcel                                                            Irrigation   Outdoor Water
                                Indoor Water Use         Chicken Water Use  Irrigated                    Total Use
             Year   Size  No. DU            Number of Chickens                      Requirement   Use
                                  (ac‐ft/yr)               (ac‐ft/yr)    Acres                           (ac‐ft/yr)
                   (acres)                                                           (ac‐ft/yr)  (ac‐ft/yr)
             2004   200   10       3.50       1,200,000     80.65        66.40       224.19      320.27  404.42
             2005   200   10       3.50       1,200,000     80.65        66.40       210.90      301.29  385.44
             2006   185    2       0.70         0.00         0.00        0.40         1.35       1.93     2.63
             2007   185    2       0.70         0.00         0.00        0.40         1.39       1.98     2.68
             2008   185    2       0.70         0.00         0.00        0.70         2.44       3.49     4.19
             2009   185    2       0.70         0.00         0.00        0.70         2.35       3.35     4.05
             2010   185    2       0.70         0.00         0.00        0.70         2.17       3.10     3.80
             2011   185    2       0.70         0.00         0.00        0.70         2.43       3.47     4.17
             2012   185    2       0.70         0.00         0.00        0.70         2.55       3.64     4.34
             2013   185    2       0.70         0.00         0.00        0.70         2.55       3.64     4.34
             2014   185    2       0.70         0.00         0.00        0.70         2.55       3.64     4.34
             2015   185    2       0.70         0.00         0.00        0.70         2.55       3.64     4.34
             2015   185    2       0.70         0.00         0.00        0.70         2.55       3.64     4.34
             2016   185    2       0.70         0.00         0.00        0.70         2.55       3.64     4.34
             2017   185    2       0.70         0.00         0.00        0.70         2.55       3.64     4.34
             2018   185    2       0.70         0.00         0.00        0.70         2.55       3.64     4.34
           Water consumption per chicken estimated at 6.0  gal/100 chickens
           Estimated Pumping by Albor Properties
                   Parcel                                  Irrigation
                                Indoor Water Use  Irrigated          Outdoor Water Use  Total Use
             Year   Size  No. DU                          Requirement
                                  (ac‐ft/yr)    Acres                   (ac‐ft/yr)   (ac‐ft/yr)
                   (acres)                                 (ac‐ft/yr)
             2004   0      0       0.00         0.00         0.00        0.00         0.00
             2005   0      0       0.00         0.00         0.00        0.00         0.00
             2006   122    2       0.70         2.60         8.76        12.52        13.22
             2007   122    1       0.35         0.40         1.39        1.98         2.33
             2008   122    1       0.35         0.40         1.40        1.99         2.34
             2009   122    1       0.35         0.40         1.34        1.92         2.27
             2010   122    1       0.35         0.40         1.24        1.77         2.12
             2011   122    1       0.35         0.40         1.39        1.98         2.33
             2012   122    1       0.35         0.40         1.46        2.08         2.43
             2013   122    1       0.35         0.40         1.43        2.04         2.39
             2014   122    1       0.35         0.40         1.49        2.13         2.48
             2015   122    1       0.35         0.40         1.39        1.99         2.34
             2016   122    1       0.35         0.40         1.33        1.90         2.25
             2017   122    1       0.35         0.40         1.33        1.90         2.25
             2018   122    1       0.35         0.40         1.33        1.90         2.25
           Estimated Pumping by Nikodinov
                   Parcel                                  Irrigation
                                Indoor Water Use  Irrigated          Outdoor Water Use  Total Use
             Year   Size  No. DU                          Requirement
                   (acres)        (ac‐ft/yr)    Acres      (ac‐ft/yr)   (ac‐ft/yr)   (ac‐ft/yr)
             2004   0      0       0.00         0.00         0.00        0.00         0.00
             2005   0      0       0.00         0.00         0.00        0.00         0.00
             2006   10     1       0.35         0.08         0.27        0.39         0.74
             2007   10     1       0.35         0.08         0.28        0.40         0.75
             2008   10     1       0.35         0.08         0.28        0.40         0.75
             2009   10     1       0.35         0.08         0.27        0.38         0.73
             2010   10     1       0.35         0.08         0.25        0.35         0.70
             2011   10     1       0.35         0.08         0.28        0.40         0.75
             2012   10     1       0.35         0.08         0.29        0.42         0.77
             2013   10     1       0.35         0.08         0.29        0.41         0.76
             2014   10     1       0.35         0.08         0.30        0.43         0.78
             2015   10     1       0.35         0.08         0.28        0.40         0.75
             2016   10     1       0.35         0.08         0.27        0.38         0.73
             2017   10     1       0.35         0.08         0.27        0.38         0.73
             2018   10     1       0.35         0.08         0.27        0.38         0.73


           Beaumont Basin Watermaster 2018 Annual Report - DRAFT - February 2019  Page 3 of 5
   136   137   138   139   140   141   142   143   144   145   146