
Page 142 - Beaumont Basin Watermaster
P. 142
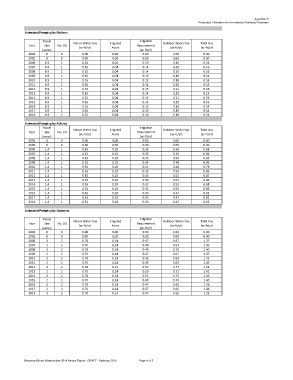
Appendix D
                                                                                    Production Estimation for Un-metered Overlying Producers
           Estimated Pumping by McAmis
                   Parcel                                  Irrigation
                                Indoor Water Use  Irrigated          Outdoor Water Use  Total Use
             Year   Size  No. DU                          Requirement
                                  (ac‐ft/yr)    Acres                   (ac‐ft/yr)   (ac‐ft/yr)
                   (acres)                                 (ac‐ft/yr)
             2004   0      0       0.00         0.00         0.00        0.00         0.00
             2005   0      0       0.00         0.00         0.00        0.00         0.00
             2006   0.9    1       0.35         0.04         0.13        0.19         0.54
             2007   0.9    1       0.35         0.04         0.14        0.20         0.55
             2008   0.9    1       0.35         0.04         0.14        0.20         0.55
             2009   0.9    1       0.35         0.04         0.13        0.19         0.54
             2010   0.9    1       0.35         0.04         0.12        0.18         0.53
             2011   0.9    1       0.35         0.04         0.14        0.20         0.55
             2012   0.9    1       0.35         0.04         0.15        0.21         0.56
             2013   0.9    1       0.35         0.04         0.14        0.20         0.55
             2014   0.9    1       0.35         0.04         0.15        0.21         0.56
             2015   0.9    1       0.35         0.04         0.14        0.20         0.55
             2016   0.9    1       0.35         0.04         0.13        0.19         0.54
             2017   0.9    1       0.35         0.04         0.13        0.19         0.54
             2018   0.9    1       0.35         0.04         0.13        0.19         0.54
           Estimated Pumping by Aldama
                   Parcel                                  Irrigation
             Year   Size  No. DU  Indoor Water Use  Irrigated  Requirement  Outdoor Water Use  Total Use
                                                Acres
                                                                        (ac‐ft/yr)
                                                                                     (ac‐ft/yr)
                                  (ac‐ft/yr)
                   (acres)                                 (ac‐ft/yr)
             2004   0      0       0.00         0.00         0.00        0.00         0.00
             2005   0      0       0.00         0.00         0.00        0.00         0.00
             2006   1.4    1       0.35         0.10         0.34        0.48         0.83
             2007   1.4    1       0.35         0.10         0.35        0.49         0.84
             2008   1.4    1       0.35         0.10         0.35        0.50         0.85
             2009   1.4    1       0.35         0.10         0.34        0.48         0.83
             2010   1.4    1       0.35         0.10         0.31        0.44         0.79
             2011   1.4    1       0.35         0.10         0.35        0.50         0.85
             2012   1.4    1       0.35         0.10         0.36        0.52         0.87
             2013   1.4    1       0.35         0.10         0.36        0.51         0.86
             2014   1.4    1       0.35         0.10         0.37        0.53         0.88
             2015   1.4    1       0.35         0.10         0.35        0.50         0.85
             2016   1.4    1       0.35         0.10         0.33        0.47         0.82
             2017   1.4    1       0.35         0.10         0.33        0.47         0.82
             2018   1.4    1       0.35         0.10         0.33        0.47         0.82
           Estimated Pumping by Gutierrez
                   Parcel                                  Irrigation
                                Indoor Water Use  Irrigated          Outdoor Water Use  Total Use
             Year   Size  No. DU                          Requirement
                                  (ac‐ft/yr)    Acres                   (ac‐ft/yr)   (ac‐ft/yr)
                   (acres)                                 (ac‐ft/yr)
             2004   0      0       0.00         0.00         0.00        0.00         0.00
             2005   0      0       0.00         0.00         0.00        0.00         0.00
             2006   2      2       0.70         0.14         0.47        0.67         1.37
             2007   2      2       0.70         0.14         0.48        0.69         1.39
             2008   2      2       0.70         0.14         0.49        0.70         1.40
             2009   2      2       0.70         0.14         0.47        0.67         1.37
             2010   2      2       0.70         0.14         0.43        0.62         1.32
             2011   2      2       0.70         0.14         0.49        0.69         1.39
             2012   2      2       0.70         0.14         0.51        0.73         1.43
             2013   2      2       0.70         0.14         0.50        0.71         1.41
             2014   2      2       0.70         0.14         0.52        0.75         1.45
             2015   2      2       0.70         0.14         0.49        0.70         1.40
             2016   2      2       0.70         0.14         0.47        0.66         1.36
             2017   2      2       0.70         0.14         0.47        0.66         1.36
             2018   2      2       0.70         0.14         0.47        0.66         1.36


           Beaumont Basin Watermaster 2018 Annual Report - DRAFT - February 2019  Page 4 of 5