
Page 127 - Beaumont Basin Watermaster
P. 127
Beaumont Basin Watermaster
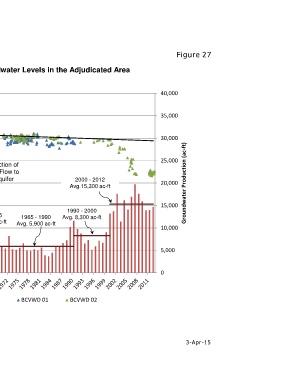
Figure 27
Groundwater Production and Groundwater Levels in the Adjudicated Area
2,350 40,000
2,300 35,000
2,250 30,000
Groundwater Level Elevation (ft amsl)
Initial
BCVWD
2,200 Pumping 25,000
Introduction of
Return Flow to
the Aquifer 2000 - 2012
2,150 20,000 Groundwater Production (ac-ft)
Avg.15,300 ac-ft
25-year Lag
2,100 15,000
1990 - 2000
1950 - 1965 1965 - 1990 Avg. 8,300 ac-ft
Avg. 6,500 ac-ft Avg. 5,900 ac-ft
2,050 10,000
1927 - 1950
Avg. 3,600 ac-ft
2,000 5,000
1,950 0
Groundwater Production in the Adjudicated Area BCVWD 01 BCVWD 02
3-Apr-15